
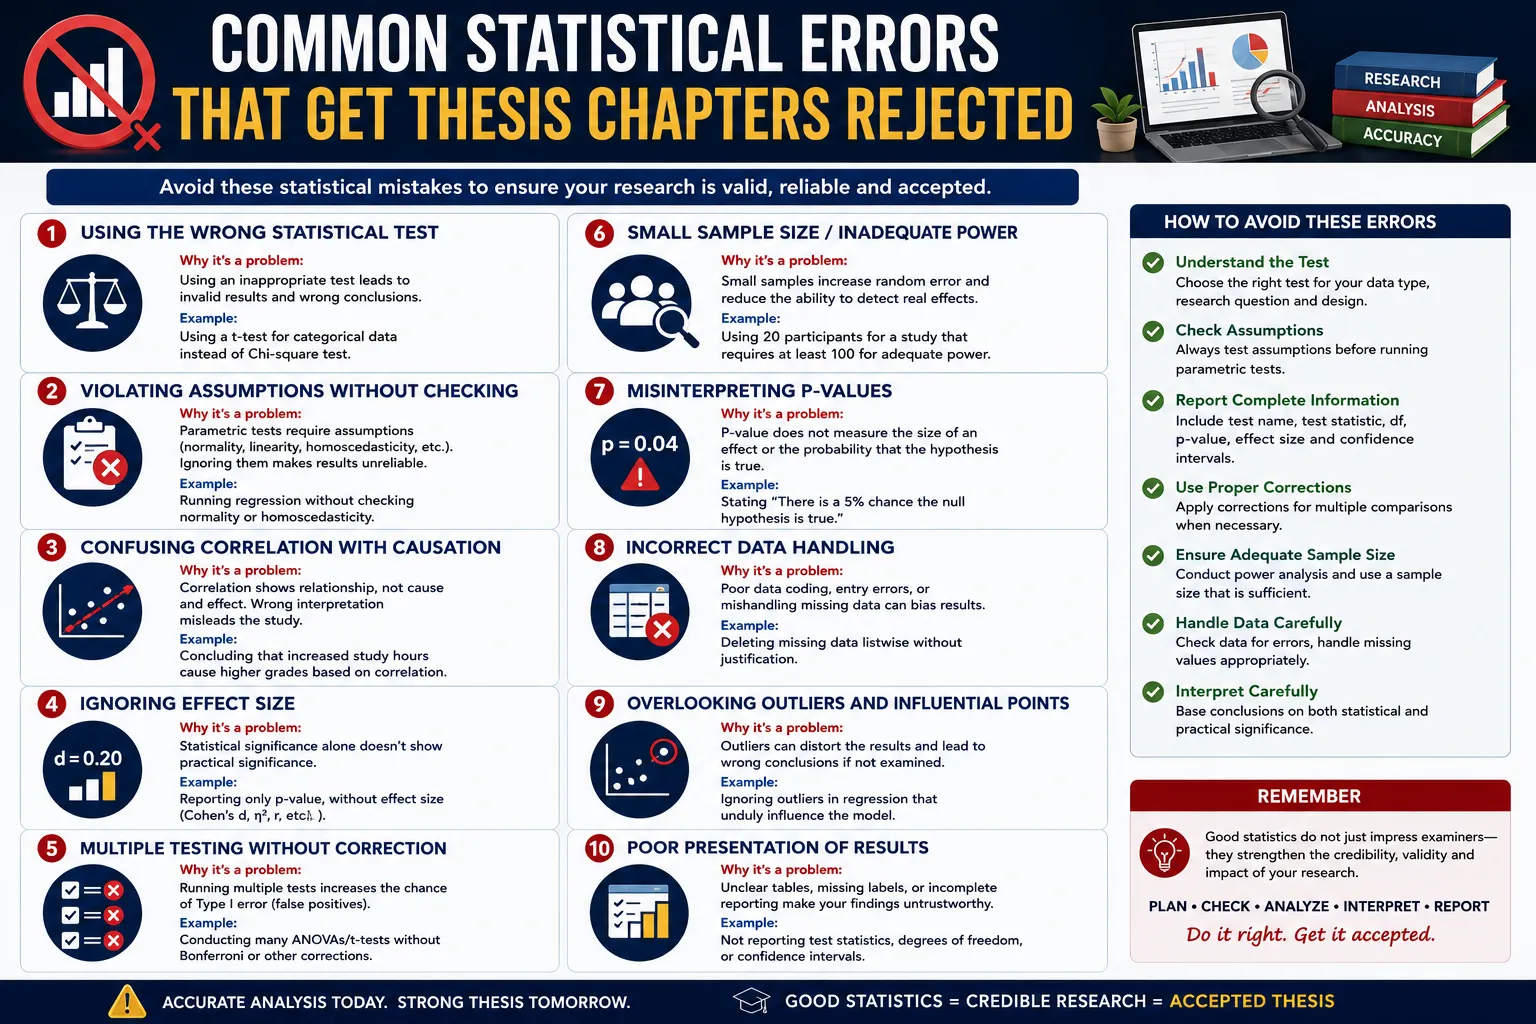
Most statistical errors in thesis work aren't dishonest — they're the result of small, understandable decisions made under deadline pressure that quietly compromise the integrity of the analysis. A test re-run with slightly different variables. A p-value of 0.053 rounded down in the write-up. A non-significant result explained away as "trending toward significance." None of these feel like misconduct in the moment, but all of them are well-documented statistical errors that examiners are specifically trained to catch. This guide walks through the common statistical errors that get thesis chapters rejected, so you can recognize and avoid them before they cost you a revision cycle.
P-Hacking: The Most Consequential Error Category
P-hacking occurs when a researcher conducts multiple significance tests and then selectively reports the tests that yield desired, usually significant, results — without correcting for the fact that multiple testing was involved. It represents a form of undisclosed cherry-picking, or "fishing," for a specific significant result rather than reporting what the data actually showed across all tests attempted.
P-hacking takes several specific, recognizable forms:
- Preferential rounding — reporting a p-value of 0.053 as "<0.05," rounding away an inconvenient result
- Selective reporting — reporting only the dependent or independent variables that produced significant results, while quietly omitting others that were tested but didn't
- Inappropriate subgroup analysis — splitting a dataset into smaller subgroups until one subgroup happens to show significance
- Test-switching — running an initial test, getting a non-significant result, then trying a different test (disregarding its underlying assumptions) until one produces the desired outcome
The scale of the risk here is worth understanding concretely. If 20 independent tests are conducted at the standard 0.05 significance level, there's almost a 64% chance that at least one will show "significance" purely by chance — even if no real effect exists at all. Simulations of common p-hacking strategies, including optional stopping and selective outcome reporting, show they can produce false positives in up to 60% of cases under standard significance thresholds. In other words, p-hacking doesn't just bend the truth slightly — it can manufacture results from data that contains no genuine effect whatsoever.
HARKing: Rewriting Your Hypotheses After Seeing the Results
A closely related error is HARKing — Hypothesizing After the Results are Known. This happens when a researcher discovers an unexpected significant pattern in the data, then writes the introduction and hypotheses as though that pattern had been predicted from the very beginning. This misrepresents genuinely exploratory findings as if they were confirmatory research, and it's a specific pattern examiners familiar with research methodology are trained to notice — particularly when a thesis's hypotheses align suspiciously perfectly with every significant finding and conveniently avoid every non-significant one.
If you do discover an interesting, unexpected pattern during analysis, it's entirely legitimate to report it — but report it honestly as an exploratory or post-hoc finding, not as something your original hypotheses predicted.
"Trending Toward Significance": A Phrase to Avoid Entirely
"Trending toward significance" is not a valid statistical concept, and its use is a specific, well-documented misinterpretation error. A p-value is a fixed number for a given dataset and test — it doesn't have a "direction" it's trending in. Audits of published academic literature have found hundreds of instances of this exact misuse in abstracts alone. If your result doesn't reach your pre-specified significance threshold, the honest approach is to report the exact p-value, the effect size, and its confidence interval — and to state plainly that the result did not reach statistical significance, rather than softening this with vague, unsupported language about a "trend."
Misinterpreting What a Non-Significant Result Actually Means
A genuinely striking finding from research into statistical literacy: when medical residents were surveyed on how to correctly interpret a p-value, 88% were confident they understood it correctly, and 100% got it wrong. This illustrates how deeply misunderstood correct p-value interpretation is, even among trained professionals — confidence in your understanding isn't a reliable indicator that your interpretation is actually correct.
The proper way to report and interpret a non-significant result: report the effect size with its confidence interval alongside the exact p-value, and interpret the confidence interval by stating that the data are compatible with a range of effects — a range that happens to include zero. This is meaningfully different from claiming your non-significant result "proves" there's no effect. A non-significant finding means your data couldn't rule out the possibility of no effect; it doesn't mean you've confirmed one doesn't exist.
Multiple Regression: Trying Every Combination Until Something Works
Trying various combinations of independent variables in a multiple regression — whether manually adjusting which predictors are included or relying on automated stepwise selection — is a specific, common form of p-hacking in thesis-level quantitative work. Reanalyzing a single dataset repeatedly in different ways, or switching to an alternate comparison group after disliking your initial results, falls into the same category. These behaviors often happen without any deliberate dishonest intent — researchers can slip into them simply through having "too many investigator degrees of freedom" during analysis, especially when facing pressure to find a significant result.
The safeguard here is straightforward: decide your model's variables in advance, based on your theoretical framework and literature review, before you see your results — not by iteratively testing combinations until one looks favorable.
Overfitting: When Your Model Fits Your Sample Too Well
Overfitting occurs when a statistical model is tailored too closely to the specific quirks of your particular sample dataset, capturing noise rather than a genuine underlying pattern. This is a widespread, documented issue — one survey of published psychology journal articles found overfitting to be a common problem, and it's particularly relevant for thesis writers running regression models with many predictors relative to a modest sample size. A model that explains your specific sample extremely well but wouldn't generalize to a new sample is a warning sign, not a success.
Underpowered Samples: Setting Yourself Up for a False Negative
A sample too small to reliably detect a real effect — an underpowered study — is a specific, avoidable statistical error with serious consequences. Conducting a power analysis before data collection, to confirm your planned sample size is actually sufficient to detect a meaningful effect, is the direct safeguard against this. Underpowered studies risk two problems simultaneously: missing genuine effects (false negatives), and, paradoxically, when they do detect "significant" effects, those effects are more likely to be inflated or unreliable.
Why These Errors Matter Beyond Your Own Thesis
These aren't just theoretical concerns. A large-scale replication project attempting to reproduce 100 high-profile published psychology studies succeeded in only 36% of cases, with the failures attributed partly to exactly these kinds of questionable statistical practices — underpowered samples and selective outcome reporting among them. This is a sobering reminder that these errors have measurable, real consequences for the reliability of research broadly, not just for whether your specific thesis chapter passes committee review.
Step-by-Step: Auditing Your Own Analysis for These Errors
- List every test you actually ran during your analysis, not just the ones that produced significant results
- Check whether you selected your final model's variables before or after seeing preliminary results
- Review your hypotheses section and honestly ask whether it was written before or after you saw your significant findings
- Search your write-up for the phrase "trending toward significance" or similar hedging language, and replace it with an honest, exact reporting of the p-value and effect size
- Confirm every non-significant result is reported with its effect size and confidence interval, not just dismissed or omitted
- Check whether you conducted a power analysis before data collection, or estimate post-hoc whether your sample size was adequate
- Review your final regression model and confirm its predictors were chosen based on theory, not iterative testing
- If you used stepwise selection, be prepared to explicitly justify this choice, or switch to a theory-driven Enter method instead
Practical Checklist: Is Your Statistical Analysis Free of These Common Errors?
- Every test conducted is reported, not just the ones producing significant results
- Model variables were selected based on theory before seeing results, not adjusted iteratively afterward
- Hypotheses were genuinely formulated before data analysis, not rewritten to match significant findings
- No use of "trending toward significance" or similar unsupported hedging language
- Non-significant results are reported with effect size and confidence interval, not omitted or dismissed
- A power analysis was conducted (or sample adequacy assessed) before or alongside data collection
- Regression models use a theory-driven Enter method, or Stepwise use is explicitly justified
- No p-values have been preferentially rounded to cross the significance threshold
- No subgroup analyses were run repeatedly until a significant subgroup was found without disclosure
Two Practical Scenarios
Scenario 1 — Catching HARKing Before Submission While reviewing their own draft, a scholar noticed their introduction predicted a specific interaction effect that, on reflection, had actually only emerged as a surprise finding during exploratory analysis — the original hypotheses hadn't included it. Recognizing this as HARKing, the scholar revised the introduction to reflect the actual pre-registered hypotheses, and reframed the interaction effect explicitly as an exploratory, post-hoc finding in the discussion chapter — an honest framing that strengthened rather than weakened the overall contribution.
Scenario 2 — Reporting a Non-Significant Result Correctly A scholar's regression analysis found a predicted relationship that didn't reach statistical significance (p = .09). Initially tempted to describe this as "trending toward significance," the scholar instead reported the exact p-value, the effect size, and its confidence interval, and interpreted the interval honestly as being compatible with a range of effects including zero — an approach a committee member specifically praised as more methodologically sound than the vague language used in several other students' chapters that semester.
Common Mistakes Thesis Writers Make
- Assuming familiarity with p-values means correct interpretation, when research shows even trained professionals frequently misinterpret them confidently.
- Treating a large p-value as "proof" of no effect, rather than as an inability to rule out the possibility of no effect.
- Running multiple comparisons without correction, dramatically inflating the chance of a false positive.
- Not disclosing all tests conducted, even when only reporting the significant ones was unintentional rather than deliberate.
- Building an overly complex model for a modest sample size, risking overfitting that won't generalize beyond the specific dataset.
Frequently Asked Questions
What are the common statistical errors that get thesis chapters rejected?
The most significant include p-hacking (selectively reporting significant results from multiple tests), HARKing (rewriting hypotheses to match results discovered after the fact), misusing the phrase "trending toward significance," misinterpreting non-significant results as proof of no effect, overfitting models to a specific sample, and running underpowered studies.
Why do these statistical errors matter for a thesis specifically?
Examiners familiar with research methodology are specifically trained to recognize these patterns, and their presence — even unintentional — can undermine confidence in an entire results chapter, regardless of how interesting or well-collected the underlying data actually was.
How do these errors affect a thesis's overall credibility?
Since these errors directly compromise the reliability of statistical conclusions, their presence can lead to a results chapter being sent back for revision or, in more serious cases, raise questions about the thesis's overall academic integrity.
How long does it take to complete a thesis using this approach?
Auditing your analysis for these errors before submission adds relatively little time upfront but can save significant time overall by avoiding a major revision cycle after a committee identifies a statistical integrity concern.
Is professional help available for identifying and avoiding common statistical errors in thesis chapters?
Yes. ThesisLikho's PhD-qualified experts have guided 10,000+ scholars through statistical analysis review, methodology auditing, and complete thesis writing assistance designed to catch these errors before submission.
Get Expert Guidance on Your Thesis Statistical Analysis
Avoiding these errors takes more than good intentions — it requires a careful, honest audit of your own analytical choices, often easier to catch with a second set of experienced eyes. If you'd like expert input on reviewing your statistical analysis for these common pitfalls before submission, ThesisLikho's PhD-qualified team offers statistical analysis review, methodology auditing, and complete thesis writing assistance. If you need expert guidance with your data analysis, statistical reporting, or overall results chapter, you can explore our Thesis Writing Assistance service.
Talk to a Thesis Expert → https://thesislikho.com/writing-services/thesis-writing