
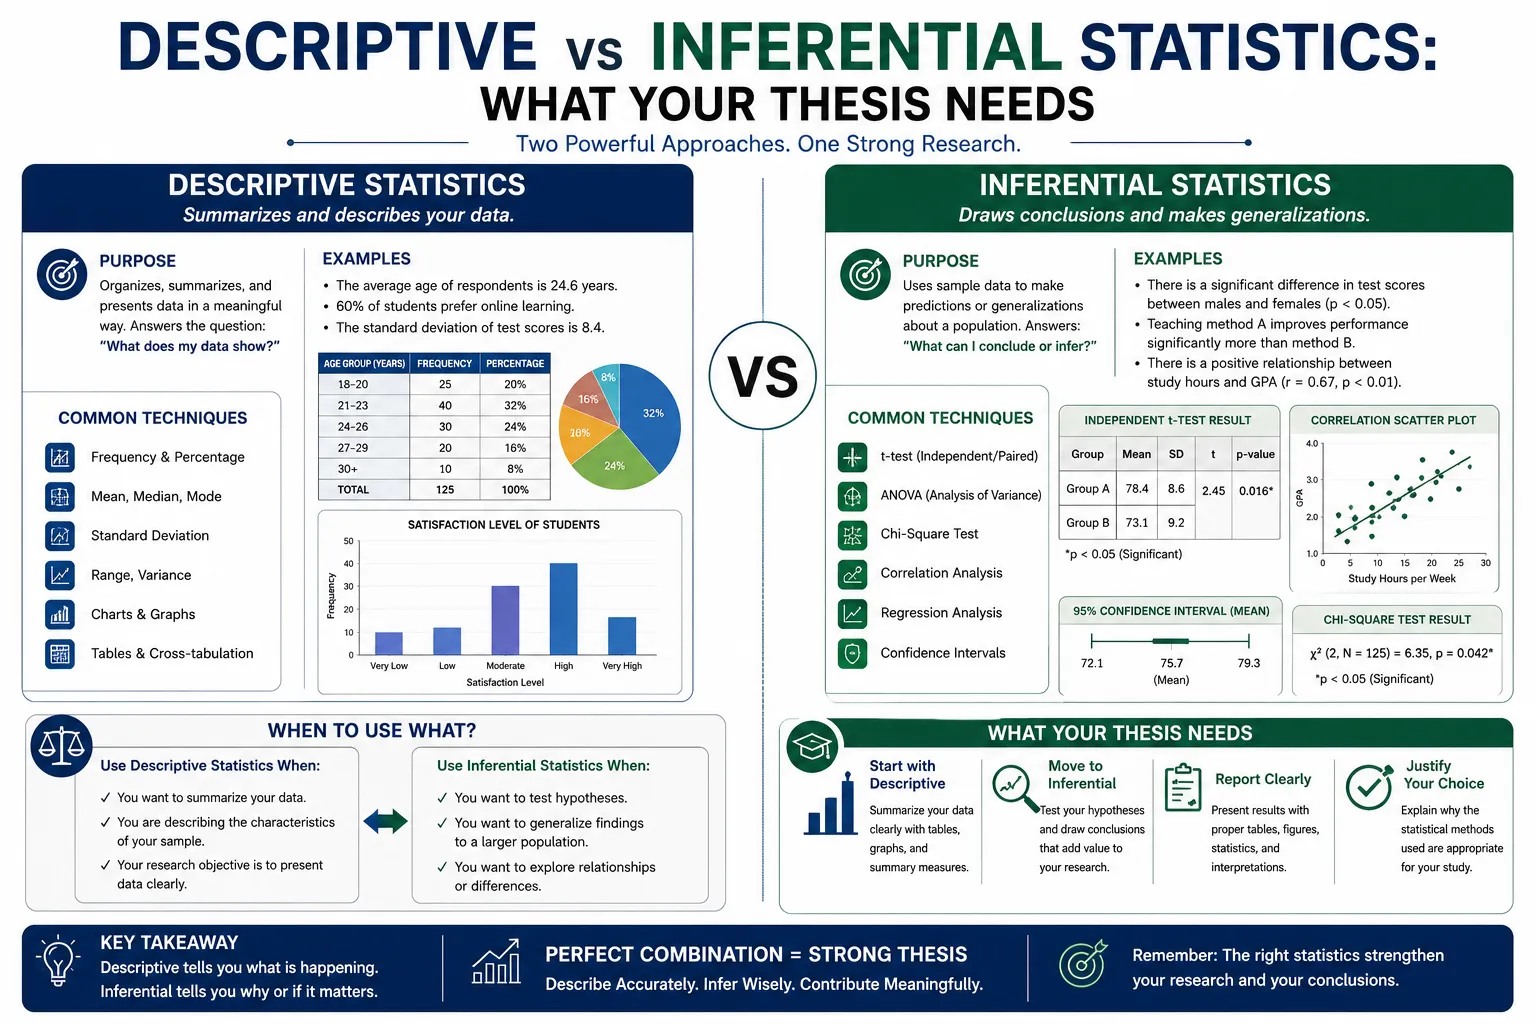
If you're staring at your data wondering whether you need to run a t-test or a chi-square test, or whether reporting means and percentages is actually enough, you're facing one of the most common points of confusion in thesis data analysis. Descriptive vs inferential statistics isn't really a choice between two competing options — it's a question of what your specific research question is actually asking, and most theses genuinely need both, just for different parts of the results chapter.
This guide walks through exactly what separates these two categories, how to tell which one your specific research question calls for, and how APA style expects you to report each — written for first-time thesis writers in India who want a clear, practical decision framework rather than a textbook definition.
The Core Difference, in Plain Terms
Descriptive statistics summarize the data you actually collected — nothing more, nothing less. If you surveyed 150 employees and want to report their average age, the percentage who identify as satisfied with their job, or the range of tenure in your sample, you're using descriptive statistics. You're describing exactly who and what you studied.
Inferential statistics go a step further: they use your sample data to draw conclusions or make predictions about a larger population you didn't directly study. If you want to claim that your finding about those 150 employees likely holds true for employees at similar companies more broadly — not just the specific 150 people you surveyed — you need inferential statistics, and specifically, statistical tests that account for the uncertainty involved in generalizing from a sample to a population.
The distinction genuinely matters for your thesis because it determines which specific tools, tests, and reporting conventions apply to each part of your results chapter — and most theses, done well, use both together rather than choosing one over the other.
What Descriptive Statistics Actually Do
Descriptive statistics answer the question "what does my data actually look like?" This includes measures of central tendency (mean, median, mode), measures of spread (standard deviation, range, interquartile range), and simple frequency counts or percentages for categorical data. Descriptive statistics make no claims beyond the specific sample you studied — they don't tell you anything about whether your findings would hold true for a different group of people, a different time period, or a broader population.
Every thesis needs descriptive statistics, regardless of what your broader research question is. Before any inferential test makes sense to a reader, they need to understand who your sample actually was — its size, its key characteristics, and how your key variables were distributed within it.
What Inferential Statistics Actually Do
Inferential statistics answer a different, more ambitious question: "based on what I found in my sample, what can I reasonably conclude about the larger population?" This includes hypothesis tests (t-tests, ANOVA, chi-square tests), correlation and regression analysis used to test relationships rather than simply describe them, and confidence intervals that express a range of plausible values for a population parameter based on your sample.
Inferential statistics are what let you write sentences like "there is a statistically significant difference in job satisfaction between remote and in-office employees" as a claim about employees generally, not just the specific people in your sample. This generalization is powerful, but it comes with real conditions attached — most importantly, that your sample was collected in a way that genuinely represents the population you're trying to generalize to.
Why Most Theses Need Both, Not One or the Other
This is the single most important practical point in this entire guide: framing descriptive and inferential statistics as competing choices is usually the wrong mental model. A typical thesis results chapter uses descriptive statistics first, to establish exactly who your sample was and how your key variables behaved, and then moves to inferential statistics, to test the actual hypotheses your research question is built around. Skipping straight to inferential tests without first establishing solid descriptive groundwork is a commonly flagged issue in academic review — readers and examiners need to understand your sample before they can meaningfully evaluate whether your inferential conclusions are trustworthy.
The genuine exception is a thesis that's explicitly and only descriptive in its research question — for instance, a study purely documenting the current state of a specific practice or population without any comparison, relationship-testing, or generalization claim built in. These are less common at thesis level but do exist, particularly for exploratory or foundational studies establishing baseline data in an under-researched area.
How to Tell Which One Your Research Question Needs
Look directly at the verbs and framing in your research question. Questions asking to "describe," "summarize," or "document" a specific characteristic within your sample point toward descriptive statistics doing the primary work. Questions asking whether something "differs," "predicts," "relates to," "affects," or "is associated with" something else — and especially any question implicitly or explicitly claiming relevance beyond your specific sample — point toward inferential statistics.
A genuinely useful practical test: if your research question or hypothesis could be reasonably restated as "is this true for [population], not just for the people I studied," you need inferential statistics to test it properly, alongside the descriptive statistics establishing your sample in the first place.
Choosing the Right Descriptive Statistic for Your Data Type
Not every descriptive statistic fits every kind of data, and choosing the wrong one is a common, avoidable error. For continuous data that's reasonably normally distributed — most standardized survey scale scores, for instance — the mean and standard deviation are the appropriate summary. For continuous data that's meaningfully skewed, the median and interquartile range give a more honest picture, since the mean can be pulled in a misleading direction by outliers or a skewed distribution. For categorical data — gender, department, yes/no responses — frequencies and percentages are the standard, appropriate summary rather than a mean, which doesn't meaningfully apply to categories.
Checking your data's actual distribution before defaulting to mean and standard deviation is a small step that meaningfully strengthens your results chapter's credibility, since reporting a mean for heavily skewed data can genuinely misrepresent what your sample actually looks like.
Choosing the Right Inferential Test
Once you've confirmed your research question genuinely calls for inference, the specific test depends on your data type and what you're testing. Comparing two groups on a continuous outcome typically calls for an independent samples t-test. Comparing three or more groups calls for one-way ANOVA. Testing a relationship between two continuous variables calls for correlation analysis. Testing whether one or more variables predict an outcome calls for regression analysis. Testing relationships between categorical variables calls for a chi-square test. Comparing the same group's scores at two different time points calls for a paired samples t-test rather than an independent one.
Each of these tests carries its own specific assumptions — about sample size, distribution, and independence of observations — that are worth checking before running the test itself, since a test whose assumptions your data doesn't meet can produce results that look statistically valid without genuinely being trustworthy.
The Assumption Most Thesis Writers Skip
This deserves its own section because it's genuinely, consistently overlooked: inferential statistics are only as trustworthy as your sample's representativeness of the population you're generalizing to. If your sample isn't collected through random or otherwise genuinely unbiased sampling, you can't validly make statistical inferences about a broader population, no matter how significant your p-value looks or how sophisticated your statistical test is.
This matters practically for a thesis relying on convenience sampling — a very common, often unavoidable approach for student researchers with limited time and resources. It doesn't mean inferential statistics can't be used at all with a convenience sample, but it does mean you need to explicitly acknowledge this limitation in your methodology and discussion chapters, tempering how confidently you generalize your findings, rather than presenting convenience-sample-based inferential results as if they carry the same generalizability as a properly randomized sample would.
Reporting Descriptive Statistics in APA Style
APA 7th edition requires reporting descriptive statistics for all study variables, typically presented before your inferential results — examiners and reviewers routinely flag results chapters that jump straight to hypothesis testing without first describing the sample clearly. Quantitative variables are typically reported using means and standard deviations; categorical variables (most demographic variables, for instance) are reported using frequencies and percentages.
For presentation format, APA's general guidance is a useful rule of thumb: if you're presenting three or fewer numbers, a sentence in your text is usually sufficient; for larger sets of related numbers, a table or figure is typically clearer for readers to follow. Some fields and supervisors also expect 95% confidence intervals reported alongside descriptive means, particularly when a study is primarily descriptive in nature or when you're reporting population estimates from a survey rather than following up with a separate inferential test.
Reporting Inferential Statistics in APA Style
For every inferential test in your results chapter, APA requires, at minimum: the specific test name (independent samples t-test, one-way ANOVA, and so on), the test statistic along with its degrees of freedom, the precise p-value, sufficient descriptive data to help readers understand the outcome, and — wherever possible — an effect size alongside a confidence interval. Reporting a p-value alone, without an accompanying effect size, is increasingly considered incomplete reporting, since statistical significance and practical significance are genuinely different things, and an effect size tells your reader how large and meaningful a finding actually is, not just whether it's unlikely to be due to chance.
A precise formatting detail worth getting right: report p-values to their actual precision except when they fall below .001, in which case APA style expects "p < .001" rather than an exact tiny decimal, and never "p = .000," since a probability can never literally equal zero. Non-significant findings should be reported with the same structure and detail as significant ones — the test statistic, degrees of freedom, and p-value — rather than dismissed with vague language like "no effect was found," since a non-significant result is still a genuine, reportable finding.
A Realistic Example: One Dataset, Both Types of Statistics
Consider a thesis studying whether remote work arrangement predicts employee job satisfaction, using survey data from 200 employees across several companies. The results chapter would open with descriptive statistics: the sample's demographic breakdown (age, gender, tenure, department, reported as frequencies and percentages), and descriptive summaries of the key continuous variables — average job satisfaction score and its standard deviation, average hours worked remotely per week.
Only after this descriptive groundwork is established would the chapter move to the actual research question — whether remote work arrangement predicts job satisfaction — using an inferential test, likely a regression analysis given the predictive framing of the question, reporting the regression coefficient, its statistical significance, an effect size, and a confidence interval. The descriptive statistics establish who was studied and what the raw data looked like; the inferential statistics test the actual hypothesis and support (with appropriate caveats about sample representativeness) any claim about employees more broadly.
Common Mistakes When Choosing Between Descriptive and Inferential Statistics
- Jumping straight to inferential tests without first reporting solid descriptive statistics establishing the sample
- Running an inferential test and generalizing confidently to a broader population without acknowledging sampling limitations, especially with convenience samples
- Reporting a mean and standard deviation for heavily skewed data, when median and interquartile range would more honestly represent the distribution
- Reporting only a p-value without an accompanying effect size or confidence interval
- Treating a non-significant finding as if it isn't worth reporting in detail, rather than presenting it with the same statistical rigor as a significant result
- Confusing statistical significance with practical importance — a statistically significant result with a very small effect size may not be practically meaningful, and this distinction is worth discussing explicitly
Quick Decision Checklist
Use this to confirm your results chapter's statistics are appropriately matched to your research question:
- Every key variable in your study has appropriate descriptive statistics reported, matched to its data type (mean/SD for normal continuous data, median/IQR for skewed data, frequencies/percentages for categorical data)
- Descriptive statistics for your sample are presented before any inferential results
- Any claim generalizing beyond your specific sample is backed by an appropriate inferential test, not just a descriptive pattern
- Your specific inferential test matches your research question's actual structure (comparison, relationship, or prediction)
- Effect sizes and confidence intervals are reported alongside p-values for every inferential test, not p-values alone
- Sampling limitations are explicitly acknowledged if you're using convenience sampling and making inferential claims
- Non-significant findings are reported with the same statistical detail as significant ones
How Long Does This Add to Your Analysis Timeline?
Correctly separating and reporting both descriptive and inferential statistics doesn't typically add meaningful extra time to a well-planned analysis, since both are usually run within the same overall statistical software session. What does add time is going back to correct a results chapter that skipped proper descriptive reporting or ran an inferential test without checking its assumptions — this kind of rework, caught late by a supervisor, commonly adds one to two weeks to your results chapter that thoughtful upfront planning would have avoided entirely.
Across a typical thesis, budgeting a dedicated week specifically for descriptive statistics and sample-characterization reporting, before moving into your main inferential analysis, is a realistic, low-risk way to make sure this foundational step doesn't get rushed or skipped under deadline pressure.
If you'd like expert guidance on which statistics your specific research question needs, or a review of your results chapter before submission, you can explore our Thesis Writing service, where our PhD-qualified mentors help scholars match their analysis approach to their actual research question and report it correctly in APA style.
FAQs
What is the difference between descriptive vs inferential statistics for a thesis?
Descriptive statistics summarize the characteristics of the specific sample you studied, while inferential statistics use that sample data to draw conclusions or make generalizations about a larger population. Most theses need both — descriptive statistics to establish the sample, and inferential statistics to test the actual research hypotheses.
Why does the descriptive vs inferential statistics distinction matter for a thesis?
Using the wrong type of statistic for your research question — or generalizing to a population without a valid inferential test and a representative sample — undermines your thesis's credibility. Examiners specifically check whether your reported statistics genuinely match what your research question is actually asking.
When should a thesis use inferential statistics instead of just descriptive ones?
Whenever your research question involves comparing groups, testing relationships, making predictions, or claiming your finding applies beyond the specific sample you studied. If your question is purely about describing or summarizing your sample's characteristics without any generalization claim, descriptive statistics alone may be sufficient, though this is less common at thesis level.
How long does it take to complete a thesis using this approach?
Correctly reporting both descriptive and inferential statistics doesn't typically add significant extra time if planned from the start — budgeting roughly one dedicated week for thorough descriptive reporting before moving into inferential analysis is a realistic, low-risk approach within a typical thesis timeline.
Is professional help available for descriptive vs inferential statistics what your thesis needs?
Yes. Many scholars work with experienced thesis mentors to determine exactly which statistical approach their specific research question calls for, and to ensure both descriptive and inferential results are reported correctly in APA style — this is exactly the kind of support ThesisLikho's PhD-qualified mentors provide.
Talk to a Thesis Expert: If you're unsure whether your specific research question needs descriptive statistics, inferential statistics, or both, ThesisLikho's PhD-qualified mentors can help you choose the right approach and report it correctly. Explore our Thesis Writing Service →