
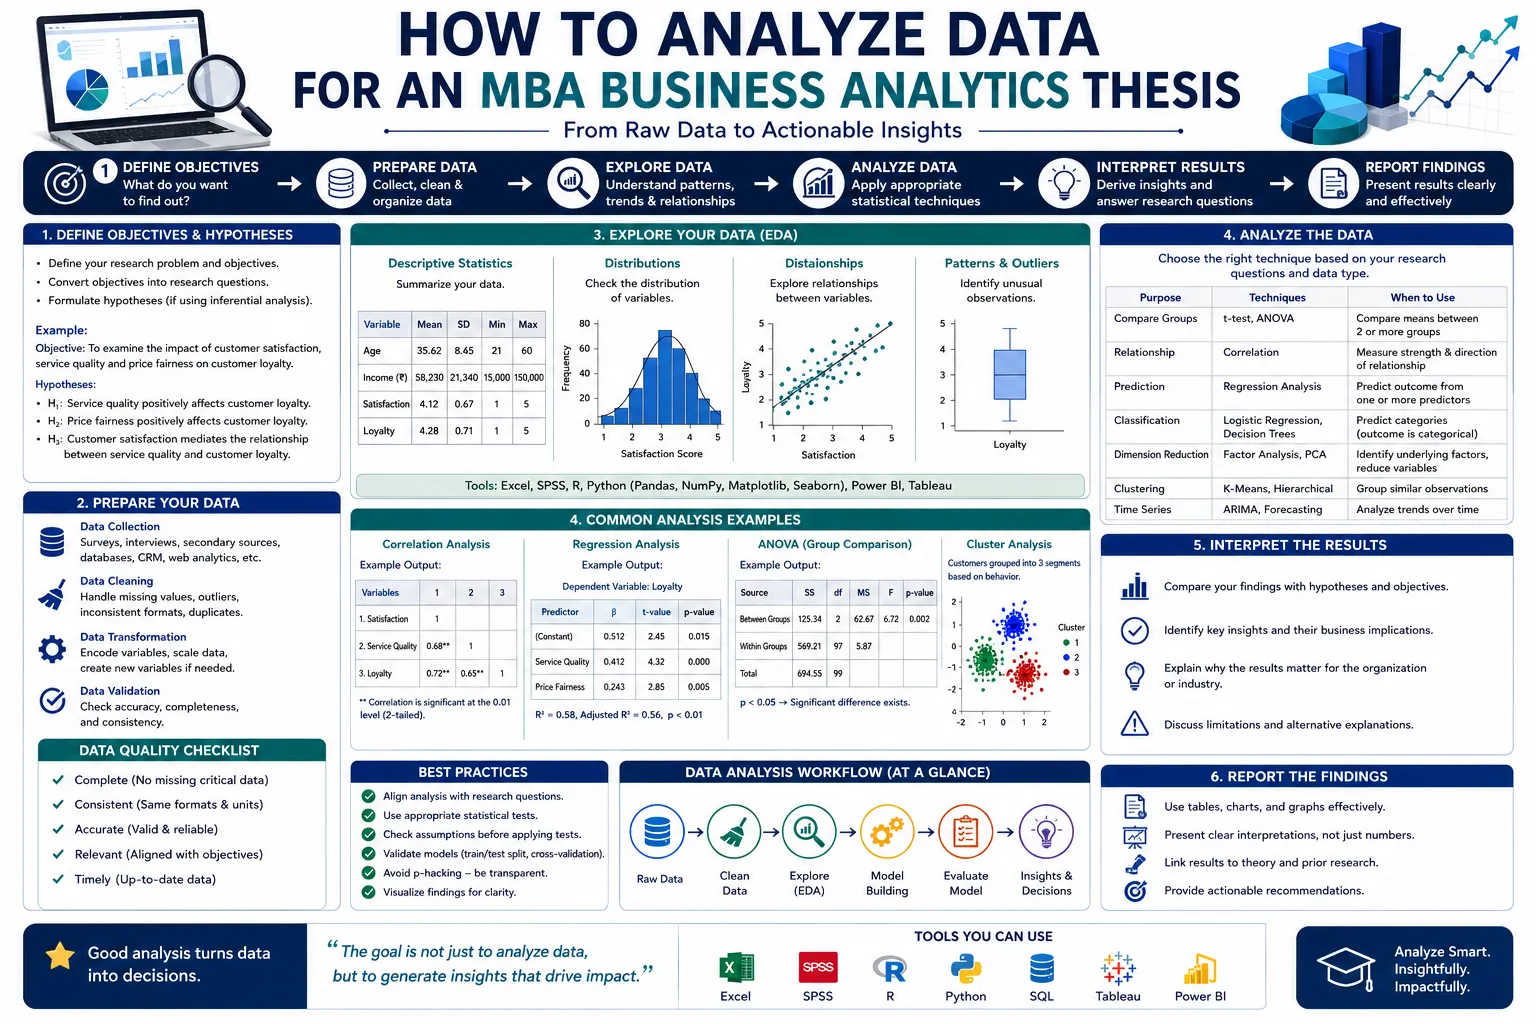
Once your methodology is settled and your data is in hand, the real work begins: actually exploring, shaping, and modeling your dataset in a way that produces genuine business insight rather than just technically correct output. This guide walks through how to analyze data for an MBA business analytics thesis, from initial exploration through to visualization and interpretation — the hands-on execution stage that turns a well-designed methodology into an actual results chapter.
Start With Exploratory Data Analysis, Not Modeling
Exploratory Data Analysis (EDA) is a method of analyzing datasets to understand their main characteristics — summarizing data features, detecting patterns, and uncovering relationships through visual and statistical techniques. This step matters more than it might seem: having physical access to a large amount of data doesn't guarantee good business decisions. Real understanding only comes once the actual meaning behind the data is uncovered through structured exploration, before you commit to a specific modeling approach.
Skipping EDA and jumping straight to modeling is one of the most common shortcuts that weakens an MBA business analytics thesis — you end up building a model without genuinely understanding the data it's built on, which makes both your modeling choices and your eventual interpretation weaker.
A Standard EDA Workflow to Follow
A structured EDA workflow for business analytics research typically follows this sequence:
- Univariate analysis — understanding each variable individually (its distribution, central tendency, spread, and any obvious anomalies)
- Bivariate analysis — examining relationships between pairs of variables
- Correlation analysis — quantifying the strength and direction of relationships between numeric variables
- Distribution plots — visualizing whether variables are normally distributed or skewed
- GroupBy-based aggregations — summarizing data across meaningful business categories (region, product line, customer segment, time period)
This sequence moves deliberately from understanding single variables in isolation toward understanding how they relate to each other — a logical progression that also makes your eventual results chapter easier to write, since you can walk your reader through the same build-up.
Why Checking Distribution Matters Before You Model
The distribution of your data — whether normal or skewed — plays an important role in selecting the appropriate statistical or machine learning model. This check should happen during EDA, before you commit to a specific technique, since many models carry underlying distributional assumptions that, if violated, undermine the reliability of your eventual results.
Engineer Features That Actually Serve Your Business Question
Feature engineering is the process of improving a model's accuracy by creating new, more informative variables from your existing data. This isn't a purely technical exercise — good feature engineering is where your business understanding directly shapes your analytical output.
Common feature engineering tasks relevant to MBA business analytics theses include:
- Encoding categorical variables — converting categories like region, product type, or customer segment into a format your model can use
- Scaling and normalization — putting numeric variables on comparable scales, particularly important for distance-based or regularized models
- Time-based feature extraction — converting a date field into more informative components like "day of week" or "month," which can capture business-relevant seasonality that a raw date field alone wouldn't reveal
- Dimensionality reduction — techniques like Principal Component Analysis (PCA) can simplify data while retaining its essential information, particularly useful when working with complex, high-dimensional business datasets containing many correlated variables
Treat variable selection as an active, deliberate decision throughout this process — dropping columns that don't add analytical value, and adding engineered columns that genuinely contribute to your specific research question, rather than defaulting to using every available column simply because it exists in your dataset.
Visualize to Communicate, Not Just to Explore
Visualization serves two distinct purposes in a business analytics thesis, and it's worth being clear about which one you're doing at any given moment. During EDA, visualization helps you understand your data — quick, exploratory plots that may never appear in your final thesis. Later, visualization helps communicate your findings to your reader — polished, purposeful charts that support a specific point in your results chapter.
Python's Matplotlib and Seaborn libraries are widely used for producing publication-ready static plots suited to a written thesis chapter, while tools like Plotly are more commonly used for interactive dashboards — relevant if your thesis includes a supplementary interactive component beyond the written document itself. Choose your visualization tool based on this distinction, and don't confuse a quick exploratory scatter plot with the kind of clean, labeled, reader-ready chart your final results chapter actually needs.
Build, Compare, and Interpret Your Models
Once your EDA and feature engineering are complete, move to your substantive modeling. A few principles worth keeping in mind at this stage:
Model selection can be genuinely iterative. Current academic thinking on model exploration increasingly supports scenarios where the appropriate model type isn't known at the outset — meaning it's entirely legitimate to compare several candidate models rather than committing to a single technique from the start, provided your final choice is clearly justified in your write-up.
Comparison should be systematic, not arbitrary. If you're comparing multiple models (for example, logistic regression against a random forest for a classification task), evaluate them using the same metrics on the same held-out data, and report the comparison transparently — including cases where a simpler model performs comparably to a more complex one, since this itself is a meaningful finding.
Interpretation is what converts output into insight. A complete business analytics workflow moves through data cleaning, exploratory analysis, visualization, interpretation, and reporting — with each stage serving a distinct purpose: cleaning ensures accuracy, EDA discovers patterns, visualization communicates results, and interpretation converts charts and numbers into actionable business decisions. Meaningful insight requires both technical processing and genuine business understanding — a technically correct chart that isn't interpreted in business terms leaves your thesis's core contribution underdeveloped.
A Representative End-to-End Example
A useful way to see this full pipeline in action: consider a customer churn analysis for a telecom-style business problem. The workflow moves from exploring customer behavior data (EDA) to identifying which factors are associated with customers leaving (feature engineering and correlation analysis) to building and comparing predictive models (modeling) to explaining, in business terms, which specific factors most strongly predict churn and what that means for retention strategy (interpretation). This is the same underlying pipeline your MBA thesis should follow, whatever your specific business analytics topic — the value isn't in any single step, but in how clearly each step connects to the next, ending in a genuinely actionable business conclusion.
Step-by-Step: Structuring Your Data Analysis
- Load and clean your data, addressing missing values, duplicates, and inconsistencies before any exploration begins
- Conduct univariate and bivariate EDA to understand individual variables and initial relationships
- Run correlation analysis and check distributions to inform your later modeling choices
- Engineer features specifically relevant to your business question — encoding, scaling, time-based extraction, or dimensionality reduction as needed
- Visualize your data exploratorily first, then separately produce polished, reader-ready visualizations for your results chapter
- Select and justify your modeling approach, comparing candidate models systematically if more than one is genuinely plausible
- Evaluate your chosen model using metrics appropriate to your specific task
- Interpret your results explicitly in business terms, not just statistical or technical terms
- Connect your interpretation back to the original business problem that motivated your research question
Practical Checklist: Is Your Business Analytics Data Analysis Ready?
- EDA (univariate, bivariate, correlation, distribution checks) completed before any modeling began
- Feature engineering decisions (encoding, scaling, time-based extraction, dimensionality reduction) are deliberate and justified
- Irrelevant variables are dropped, and engineered variables genuinely contribute to the research question
- Exploratory visualizations and final reader-facing visualizations are kept clearly distinct
- Model comparison, if conducted, uses consistent metrics on the same held-out data
- Final model choice is explicitly justified, not simply the first one tried
- Results are interpreted in business terms, not left as purely technical or statistical output
- Findings are connected clearly back to the original business problem
Two Practical Scenarios
Scenario 1 — Catching a Skewed Distribution Before Modeling A scholar analyzing customer transaction values for a retail dataset ran distribution plots during EDA and found the data was heavily right-skewed, with a small number of very large transactions pulling the mean well above the typical value. Recognizing this early, the scholar applied a log transformation as part of feature engineering before running a regression model — avoiding a common pitfall where an unaddressed skewed distribution would have distorted the model's coefficients and, ultimately, the thesis's conclusions.
Scenario 2 — Turning Technical Output Into a Business Conclusion A scholar's churn prediction model identified contract type and tenure as the strongest predictors of customer churn, reporting feature importance scores from a random forest model. Rather than stopping at the technical output, the scholar explicitly interpreted this in business terms: customers on shorter contracts and with lower tenure represented the highest churn risk, suggesting the company's retention efforts should specifically target early-tenure customers with incentives to move to longer-term contracts — converting a statistical finding into an actionable business recommendation, which is exactly what an MBA-level interpretation needs to do.
Common Mistakes MBA Business Analytics Thesis Writers Make Analyzing Data
- Skipping EDA and moving straight to modeling, missing an opportunity to catch data issues or inform modeling choices early.
- Engineering features without a clear link to the research question, adding complexity without adding genuine analytical value.
- Confusing exploratory visualizations with final, reader-ready charts, presenting rough exploratory plots in the results chapter.
- Comparing models inconsistently, using different data splits or metrics that make the comparison unreliable.
- Stopping at technical output (accuracy scores, feature importance values) without interpreting what the findings actually mean for the business problem.
Frequently Asked Questions
How do you analyze data for an MBA business analytics thesis?
Start with exploratory data analysis to understand your variables and their relationships, engineer features that genuinely serve your business question, visualize your data both for your own exploration and separately for reader-facing presentation, build and systematically compare models if more than one approach is plausible, and interpret your findings explicitly in business terms.
Why does the analysis process matter for an MBA business analytics thesis?
A technically correct model that isn't grounded in thorough EDA or interpreted in business terms produces a weaker thesis contribution — the value of business analytics research lies specifically in connecting technical findings to actionable business insight, not in technical sophistication alone.
How does data analysis quality affect an MBA thesis's overall contribution?
Since business analytics theses are evaluated on both technical rigor and business relevance, skipping foundational steps like EDA or failing to interpret findings in business terms weakens the thesis's core contribution regardless of how sophisticated the underlying model is.
How long does it take to complete an MBA thesis using this approach?
Investing time in thorough EDA and feature engineering upfront typically saves time overall, since it reduces the risk of building a model on poorly understood data and having to redo the analysis after discovering an issue later.
Is professional help available to analyze data for an MBA business analytics thesis?
Yes. ThesisLikho's PhD-qualified experts have guided 10,000+ scholars through business analytics data analysis, model building, and complete MBA thesis writing assistance tailored to individual research questions.
Get Expert Guidance on Your MBA Business Analytics Data Analysis
Moving from a well-designed methodology to a genuinely insightful data analysis takes careful attention to exploration, feature engineering, and business-focused interpretation at every step. If you'd like expert input on your EDA process, model comparison, or interpreting your findings in business terms, ThesisLikho's PhD-qualified team offers data analysis support, model building guidance, and complete MBA thesis writing assistance. If you need expert guidance with your data analysis, results chapter, or overall thesis structure, you can explore our MBA Thesis Assistance service.
Get Free MBA Thesis Consultation → https://thesislikho.com/writing-services/thesis-assistance-mba