
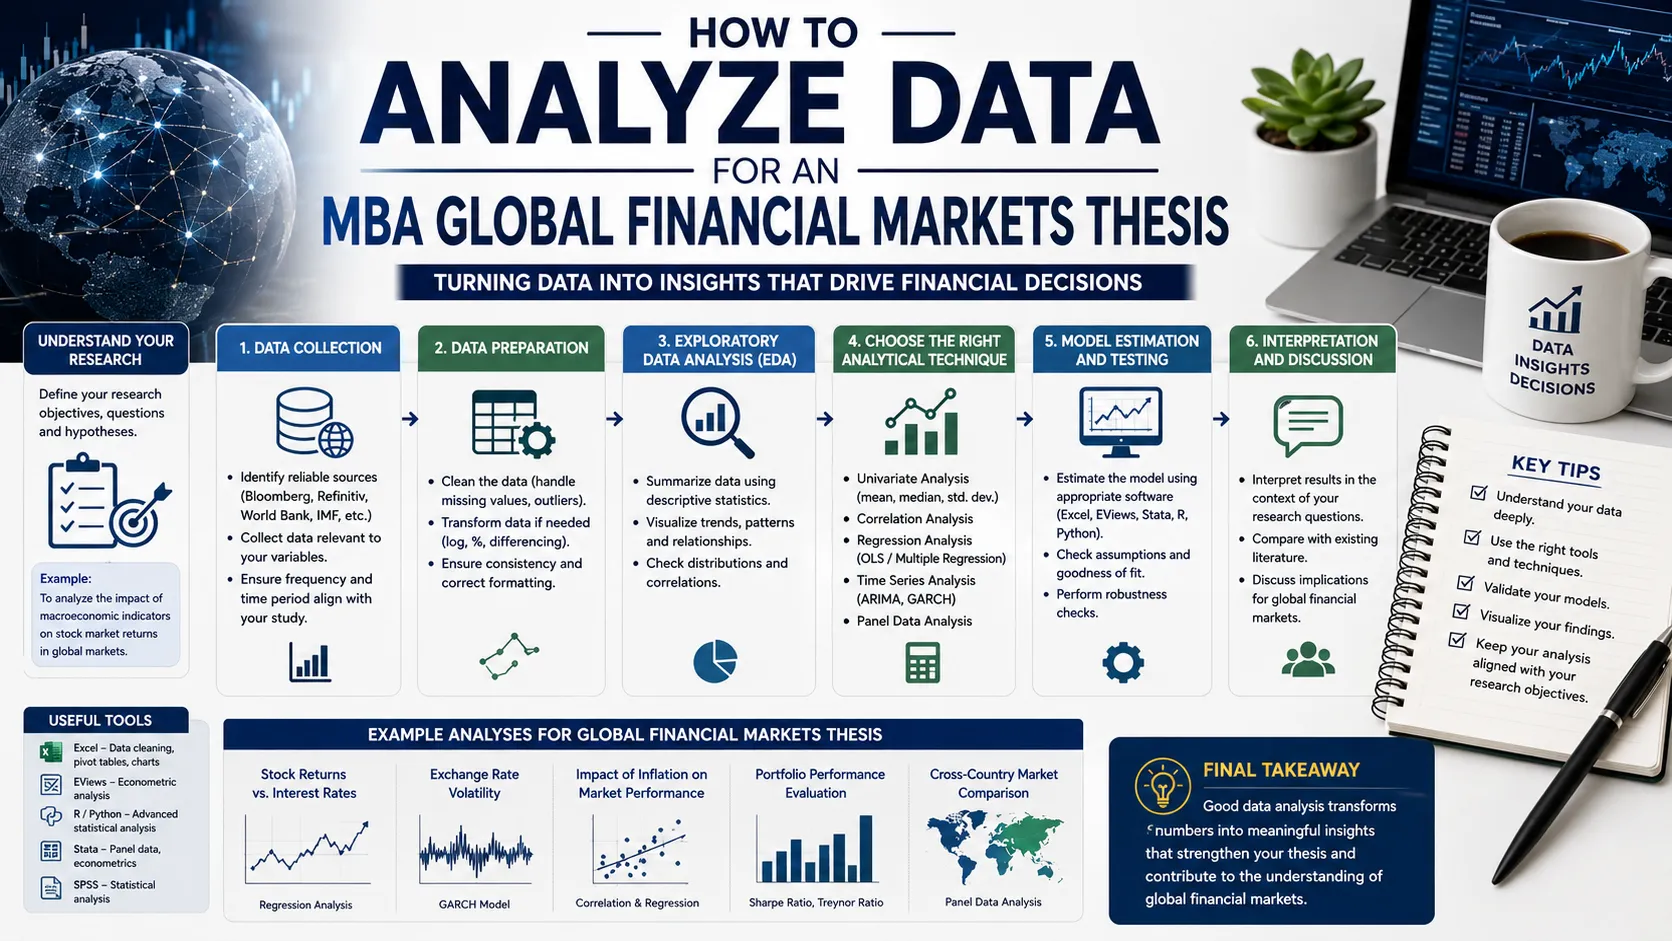
You've pulled stock price data around a policy announcement, or built a portfolio return series spanning a volatile market period, or gathered financial ratios across a set of comparable firms — and now you need to turn that into an analysis chapter that actually holds up. Learning how to analyze data for an MBA global financial markets thesis means matching your technique to what financial markets research specifically investigates — market reaction to events, volatility behavior, portfolio performance, risk exposure — rather than applying generic business statistics that don't quite capture what financial data is actually doing.
This guide walks through the analytical techniques that dominate MBA-level financial markets research: event study methodology, volatility modeling, portfolio performance metrics, and standard financial ratio and regression analysis. We've grounded this in current 2026 financial econometrics practice and the patterns we see across MBA scholars ThesisLikho supports through the data analysis stage.
What Makes Financial Markets Data Analysis Different
Financial markets data behaves differently from most other business data in ways that directly shape how you should analyze it. Returns exhibit volatility clustering — periods of high volatility tend to follow other high-volatility periods, meaning the variance of returns isn't constant over time the way many standard statistical techniques assume. Financial time series are also typically non-stationary in their raw price form, meaning trends and shifting statistical properties over time can produce misleading results if analyzed without proper adjustment. And market data is often event-driven, meaning specific announcements, policy changes, or corporate actions can be isolated and studied for their measurable effect on prices and returns.
Most MBA global financial markets theses fall into a few recognizable analytical patterns: measuring how markets react to a specific event or announcement, modeling and forecasting volatility, evaluating portfolio or investment performance, or comparing financial characteristics across firms or markets. Identifying which pattern your thesis fits early makes choosing the right technique considerably more straightforward.
Descriptive Statistics for Financial Data
Before any specialized financial technique, descriptive statistics establish the basic shape of your data: mean returns, standard deviation (as a basic volatility measure), skewness, and kurtosis. Financial return distributions are notably prone to excess kurtosis (fatter tails than a normal distribution, meaning extreme events happen more often than a standard normal distribution would predict) and skewness — reporting these specifically, not just mean and standard deviation, is standard practice in financial markets research, since it signals to your reader that you understand your data isn't behaving like a simple, well-behaved normal distribution.
Establishing this descriptive picture clearly before moving into event studies, volatility models, or regression analysis gives your reader the context needed to evaluate whether your deeper findings make sense, and it often reveals data characteristics (like clustering or fat tails) that directly justify why a more specialized technique is needed later in the chapter.
Event Study Methodology: Measuring Market Reaction
Event study methodology is the standard technique for measuring how markets react to a specific piece of information — an earnings announcement, a merger, a regulatory change, a macroeconomic policy shift. The core logic: calculate what a stock's return "should have been" absent the event (its normal or expected return, based on a chosen benchmark model), then compare that to the stock's actual return during a defined window around the event, producing an abnormal return. Summing abnormal returns across the event window produces the cumulative abnormal return (CAR), the standard measure of an event's total market impact.
A typical event study for an MBA thesis follows a clear sequence: define your event and its exact date, define your estimation window (a period before the event used to calculate expected "normal" returns) and your event window (the period around the event itself you're measuring), calculate abnormal returns for each day in your event window, sum them into cumulative abnormal returns, and test whether these abnormal returns are statistically significantly different from zero. Several well-documented limitations are worth acknowledging explicitly in your methodology: event clustering (multiple events happening close together, making it hard to isolate one effect), thin trading in less liquid stocks, and volatility that itself changes around the event — all genuine, well-recognized constraints rather than flaws unique to your specific study.
Choosing a Normal Return Model
Your event study's credibility depends heavily on how you model the "normal" return a stock would have earned absent the event. Three models are most commonly used at MBA level: the constant mean return model, which simply uses a stock's historical average return as its expected return — the simplest option, though it ignores broader market movements; the market model, a regression of the stock's return against a market index's return over your estimation window, producing expected returns that account for how the stock typically moves with the broader market; and the CAPM-based model, using the Capital Asset Pricing Model's risk-return relationship to estimate expected returns based on the stock's beta and the market risk premium.
The market model is generally the standard, well-balanced choice for MBA-level event studies — more sophisticated than the constant mean model, without requiring the additional assumptions and complexity of a full CAPM or multi-factor model, which are more common in PhD-level financial econometrics research.
Volatility Modeling: Why Financial Data Needs Special Treatment
Financial returns don't have constant variance over time — periods of turbulence cluster together, followed by calmer periods, a pattern standard regression techniques assume away but that financial researchers need to model directly. GARCH models (Generalized Autoregressive Conditional Heteroskedasticity) are the standard family of techniques built specifically for this, modeling how volatility itself evolves and clusters over time rather than assuming it's constant.
The basic GARCH(1,1) model is the standard starting point for MBA-level volatility research, capturing how today's volatility depends on both yesterday's volatility and yesterday's squared return shock. Extensions like EGARCH and GJR-GARCH capture asymmetric effects — the common financial market pattern where negative shocks (bad news) tend to increase future volatility more than positive shocks (good news) of the same size — genuinely relevant if your research question involves how markets respond differently to good versus bad news. At MBA scale, fitting a basic GARCH(1,1) model to a return series and interpreting its parameters is usually sufficient and appropriately scoped; comparing multiple GARCH variants against each other using formal forecast accuracy metrics is more common in PhD-level volatility research, though it remains an option if your specific research question and timeline support it.
Portfolio Performance Metrics
If your thesis evaluates investment or portfolio performance, several standard metrics go beyond simple raw returns to account for risk. The Sharpe ratio measures return earned per unit of total risk (standard deviation), letting you compare portfolios or funds on a risk-adjusted basis rather than raw returns alone. Jensen's alpha measures a portfolio's actual return against what CAPM would predict given its risk level (beta), isolating whether a manager or strategy is genuinely outperforming what its risk exposure alone would explain. The Treynor ratio, similar in spirit to the Sharpe ratio but using beta (systematic risk) rather than total standard deviation as its risk measure, is particularly relevant for evaluating a portfolio that's already part of a diversified broader holding, where only systematic risk matters.
Reporting several of these metrics together, rather than relying on a single measure, is standard practice in performance evaluation research, since each captures a slightly different dimension of risk-adjusted return and no single metric tells the complete story on its own.
Regression and CAPM-Based Analysis
Beyond its use in event studies, CAPM-based regression is commonly used directly to estimate a stock or portfolio's beta (systematic risk relative to the market) and to test whether realized returns align with what the model predicts given that risk level. Multi-factor extensions — adding size, value, or momentum factors to the basic CAPM framework — are increasingly referenced in financial markets literature, though at MBA scale, a single-factor CAPM regression is usually sufficient and appropriately scoped, with multi-factor models more common in PhD-level asset pricing research.
Standard regression diagnostics matter here as much as in any other statistical analysis: checking for autocorrelation in your residuals (common in financial time series, given how returns are sequentially related over time) and confirming your model's basic assumptions hold before interpreting your beta or alpha estimates as reliable.
Financial Ratio and Comparative Analysis
If your thesis compares financial characteristics across firms — profitability, liquidity, leverage, valuation — standard financial ratio analysis remains a straightforward and appropriate MBA-level technique: calculating ratios (return on equity, current ratio, debt-to-equity, price-to-earnings) consistently across your comparison set, then using descriptive comparison or basic statistical tests (t-tests, ANOVA) to assess whether differences across groups (sectors, firm sizes, time periods) are meaningful. This kind of analysis works particularly well for comparative theses — evaluating financial performance across a specific industry, comparing pre- and post-event financial health, or benchmarking firms against sector averages.
Ensure ratio definitions are applied consistently across your entire comparison set and sourced from comparable financial statement periods, since inconsistent ratio calculation across firms is one of the more common, avoidable errors in comparative financial analysis.
Working With Time Series Data Correctly
Financial time series data has specific handling requirements that differ from cross-sectional survey data. Raw price series are typically non-stationary (trending, with statistical properties that shift over time), so most financial analysis works with returns (percentage or log price changes) rather than raw prices, since returns are generally closer to stationary and more suitable for standard statistical techniques. Checking for stationarity explicitly, using a standard test appropriate to your software, is good practice before running regression or volatility models on any financial time series.
Autocorrelation — where a variable's current value is related to its own past values — is common in financial return series and needs to be checked and, where present, appropriately addressed in your model specification (through techniques like adding lagged variables or using models designed to account for it), rather than ignored in favor of a simpler analysis that assumes independence between observations.
Choosing the Right Software Tool
Excel can handle basic descriptive statistics, simple event study calculations, ratio analysis, and even basic CAPM regression for a modest dataset, and remains genuinely sufficient for many MBA-scale financial markets theses. EViews is a purpose-built econometric software widely used in financial time series research, particularly well-suited to event studies and GARCH modeling, with a more accessible interface for scholars without extensive programming background. R and Python, using packages built specifically for financial econometrics (such as R's rugarch for GARCH modeling or Python's financial analysis libraries), offer the most flexibility and are increasingly common even at MBA level among scholars with some scripting background, particularly for more involved volatility modeling work. Bloomberg Terminal or similar financial data platforms, where accessible through your institution, provide both the raw data and built-in analytical tools for many standard financial calculations, though access is often institution-dependent rather than guaranteed for every MBA scholar.
Choose based on both your specific technique (GARCH modeling genuinely benefits from EViews or R over Excel) and your own comfort level — a well-executed Excel-based event study is stronger than a poorly executed GARCH model attempted in unfamiliar software under time pressure.
Interpreting Results Without Overclaiming
Financial markets research carries a specific risk of overclaiming that's worth being deliberately careful about: a statistically significant cumulative abnormal return around an event tells you the market reacted in a way unlikely to be due to chance — it doesn't automatically mean the event caused every subsequent price movement, particularly over longer event windows where other information may have entered the market simultaneously. Similarly, a strong Sharpe ratio or Jensen's alpha calculated over one specific historical period doesn't guarantee the same risk-adjusted performance will hold going forward — financial markets are notoriously non-stationary in this practical sense, and past performance genuinely doesn't guarantee future results.
Being explicit about your event window choice, your data period's specific market conditions, and the limitations these create for generalizing your findings is exactly the kind of methodological maturity examiners look for in financial markets research specifically, given how easy it is for confident-sounding statistical results to overstate what a single historical dataset can actually support.
Real MBA Global Financial Markets Data Analysis Example
An MBA student studying how Indian equity markets reacted to a major RBI monetary policy announcement built an event study around 45 large-cap NSE-listed stocks, using the market model to estimate normal returns from a 120-day estimation window prior to the announcement, then calculating abnormal and cumulative abnormal returns across a 5-day event window centered on the announcement date. She found statistically significant negative cumulative abnormal returns for interest-rate-sensitive sectors (banking, real estate) but no significant reaction in defensive sectors (FMCG, pharmaceuticals) — a sector-differentiated finding that added meaningful depth beyond a simple aggregate market reaction result. She complemented this with a basic GARCH(1,1) model on the Nifty 50 index around the same period, showing a clear volatility spike coinciding with the announcement that persisted for several trading days afterward, reinforcing her event study findings with an independent volatility-based confirmation of genuine market impact.
Common Data Analysis Mistakes in MBA Finance Theses
- Running an event study without a properly specified estimation window, using an estimation period too short or too close to the event itself to produce reliable normal return estimates.
- Ignoring volatility clustering by applying standard regression techniques to financial returns without checking whether a GARCH-based approach is actually needed.
- Analyzing raw prices instead of returns, running standard statistical techniques on non-stationary price series without the appropriate transformation.
- Overreaching into full multi-factor asset pricing models when a simpler CAPM-based or market model approach would answer the research question just as well within an MBA timeline.
- Reporting only mean returns and standard deviation, missing skewness and kurtosis measures that are particularly important and expected in financial data analysis.
- Treating a single portfolio performance metric as definitive, rather than reporting Sharpe ratio, Jensen's alpha, or equivalent measures together for a fuller risk-adjusted picture.
- Inconsistent financial ratio calculation across a comparison set, undermining the validity of cross-firm or cross-sector comparisons.
- Overstating causal claims from event study results, particularly over longer event windows where confounding information may have entered the market.
Data Analysis Checklist
Before finalizing your MBA global financial markets data analysis chapter, confirm you have:
- Descriptive statistics including skewness and kurtosis, not just mean and standard deviation
- A clearly justified event study design, if applicable, with a properly specified estimation and event window
- An explicitly chosen and justified normal return model (constant mean, market model, or CAPM-based)
- Volatility modeling (GARCH or equivalent) applied where your data shows evidence of clustering, rather than assumed away
- Returns used rather than raw prices for time series analysis, with stationarity checked
- Portfolio performance evaluated using multiple risk-adjusted metrics, not a single measure alone
- Financial ratios calculated consistently across your full comparison set
- Careful, appropriately cautious language around causal claims, particularly for longer event windows
- Every analytical result explicitly connected back to a specific research objective
- Limitations of your data, sample period, or chosen technique honestly acknowledged
For guidance on the methodology decisions that shape this analysis stage, our related guide, research methodology guide for MBA global financial markets dissertations, covers the design choices determining what data you'll be working with.
How Long Does It Take to Complete an MBA Thesis Using This Approach?
Data analysis for an MBA global financial markets thesis typically takes three to six weeks within an overall dissertation timeline of three to six months, depending on whether your analysis involves a single technique (a straightforward event study) or a combination (event study plus volatility modeling plus performance metrics). Scholars who select their specific technique and data period during methodology design — rather than after data collection is already complete — generally move through this stage faster, since their data collection is built from the start to support the specific analysis they intend to run.
Is Professional Help Available to Analyze Data for an MBA Global Financial Markets Thesis?
Yes — many MBA students work with academic mentors or research consultancies to design a properly specified event study, apply GARCH-based volatility modeling correctly, and interpret financial results with appropriately careful, defensible language. ThesisLikho's research experts have supported MBA scholars through exactly this stage of financial markets dissertations, helping ensure analysis is technically sound, appropriately scoped for an MBA timeline, and clearly interpreted for the committee — all while keeping the underlying research and conclusions entirely your own. Explore ThesisLikho's MBA thesis assistance services for one-on-one guidance.
FAQs
How do you analyze data for an MBA global financial markets thesis?
Start with descriptive statistics including skewness and kurtosis, then apply the technique matching your research question — event study methodology for measuring market reaction to specific events, GARCH modeling for volatility, portfolio performance metrics like Sharpe ratio and Jensen's alpha for investment evaluation, or CAPM-based regression and ratio analysis for comparative studies.
How long does it take to complete an MBA thesis using this approach?
Data analysis typically takes three to six weeks within an overall MBA financial markets dissertation timeline of three to six months, faster for scholars who select their analytical technique during methodology design rather than after data collection.
Is professional help available to analyze data for an MBA global financial markets thesis?
Yes. Research consultancies and academic mentors, including ThesisLikho's experts, help MBA students design event studies, apply volatility modeling, and interpret financial results carefully while preserving full research originality.
Why should I analyze data for an MBA global financial markets thesis carefully?
Because financial data has specific statistical properties — volatility clustering, non-stationarity, fat-tailed distributions — that generic analytical techniques don't properly account for, and misapplying standard methods to financial time series is one of the most common ways otherwise solid finance theses lose credibility.
When should you analyze data for an MBA global financial markets thesis for a MBA thesis?
Your analytical technique should be chosen during methodology design, before your data collection window is finalized, since event studies need a properly specified estimation period and volatility models need a sufficiently long return series to produce reliable results.
Ready to turn your financial markets data into a defensible thesis chapter?
Get Free MBA Thesis Consultation → https://thesislikho.com/writing-services/thesis-assistance-mba
Email: support@thesislikho.com
Mobile No.: +91-9289068414 , +91-9643802216