
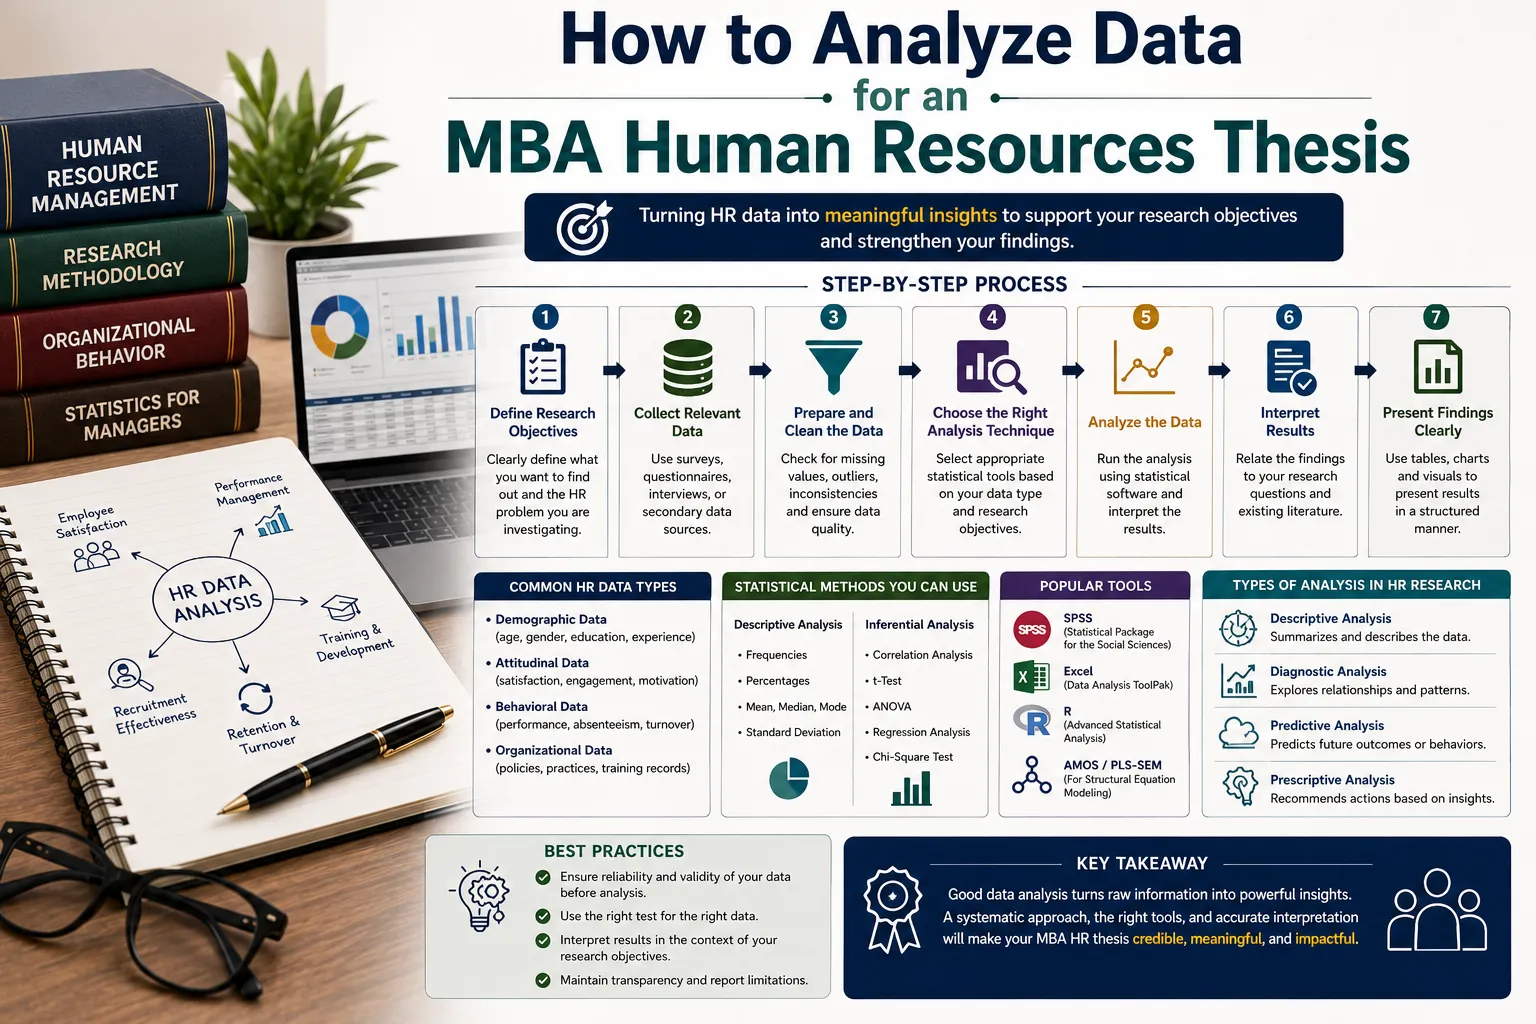
You've collected your survey responses, maybe run a few interviews, and now you're staring at a spreadsheet wondering what actually comes next. Learning how to analyze data for an MBA Human Resources thesis is where a lot of otherwise strong research projects lose momentum — not because the data is bad, but because the analysis plan wasn't decided before the data collection started.
This guide walks through the practical process: choosing the right analysis approach for your research design, running the core statistical tests HR theses rely on, interpreting your output correctly, and avoiding the mistakes that most often get an MBA HR thesis sent back for revision. Whether you're studying employee engagement, retention, leadership style, or workplace policy impact, the underlying process is largely the same.
Start With Your Research Design, Not Your Software
The single biggest factor in how to analyze data for an MBA Human Resources thesis isn't which software you use — it's what type of research question you asked in the first place. Before opening SPSS or Excel, be clear on three things: is your study quantitative, qualitative, or mixed-methods; what is your primary research question and hypothesis (if any); and what type of data will actually answer it.
An HR thesis studying "the relationship between flexible work arrangements and employee retention" needs correlation or regression analysis on numeric survey data. A thesis exploring "how mid-level managers experience change management during restructuring" needs thematic analysis of interview transcripts. A thesis combining both — engagement scores alongside open-ended employee comments — needs a mixed-methods plan that treats each data type appropriately rather than forcing qualitative comments into a spreadsheet of averages.
Deciding this upfront matters because it determines your entire data collection instrument. A questionnaire built around 5-point Likert-scale items assumes quantitative analysis; a semi-structured interview guide assumes qualitative coding. Trying to retrofit an analysis plan onto data that wasn't designed for it is one of the most common — and most time-consuming — mistakes MBA scholars make at this stage.
Step 1: Clean and Organize Your Data Before You Analyze Anything
Before you run a single test, your data needs to be clean. This step is unglamorous but skipping it is where a surprising number of analysis errors originate.
For quantitative data collected via SPSS or Excel:
- Set up your variable view correctly. Each survey item needs a clear variable name, label, and defined values — for example, coding a 5-point Likert response as 1 = Strongly Disagree through 5 = Strongly Agree, consistently across every item.
- Reverse-code negatively worded items. If a survey item is phrased in the opposite direction of the rest of the scale (e.g., "I often feel disengaged at work" on a scale where higher numbers should indicate more engagement), that item needs to be reverse-coded before it's combined with the others — otherwise it will quietly distort your reliability and correlation results.
- Check for missing data and outliers. Decide in advance how you'll handle incomplete responses — excluding them, or using an accepted imputation method — and document that decision, since a reviewer may ask.
- Screen for straight-lining. Respondents who select the same rating for every item (a common pattern in low-effort online surveys) should be flagged and, in most cases, excluded, since they add noise rather than signal.
For qualitative data — interview transcripts, focus group notes, open-ended survey responses — cleaning means transcribing recordings accurately, anonymizing respondent identifiers consistently, and organizing your raw material into a format you can code systematically, whether that's a spreadsheet, a table, or qualitative analysis software like NVivo.
Step 2: Test Reliability Before You Trust Your Instrument
If your thesis uses a multi-item scale to measure a construct — employee engagement, job satisfaction, perceived organizational support, and similar HR constructs are almost always measured this way — you need to confirm the scale is internally consistent before you use it for anything else. This is done with Cronbach's alpha, run in SPSS via Analyze → Scale → Reliability Analysis.
The conventional benchmark researchers look for is a Cronbach's alpha above 0.70, which indicates acceptable internal consistency; some fields expect a more conservative 0.80 for well-established scales. Alongside the overall alpha score, check the Corrected Item-Total Correlation for each individual item — values above 0.30 are generally considered acceptable, and any item scoring below that threshold may be weakening your scale and could be a candidate for removal, provided that removal is justified and reported transparently rather than done silently to inflate the number.
If you're also running exploratory factor analysis to confirm your survey items group into the constructs you expect, two additional checks matter: the Kaiser-Meyer-Olkin (KMO) measure of sampling adequacy, where a value above 0.6 is considered acceptable, and Bartlett's test of sphericity, where a significance value below 0.05 confirms your data is suitable for factor analysis in the first place.
Skipping reliability testing — or running it after the fact and not reporting it — is one of the fastest ways to have an examiner question your entire results chapter, since it signals the instrument itself was never validated.
Step 3: Run Descriptive Statistics First
Before jumping to hypothesis testing, describe your sample and your data. This isn't filler — it's what allows a reader to understand who you actually studied and whether your findings might reasonably generalize.
At minimum, most MBA HR theses report:
- Sample demographics: age, gender, tenure, department, seniority level — whichever variables are relevant to your research question.
- Response rate and final sample size. For most MBA HR primary research using survey methods, a sample size in the range of roughly 100 to 300 respondents is generally considered sufficient to produce statistically reliable results, though this varies by your specific statistical tests and population size.
- Means, standard deviations, and frequency distributions for your core variables — this is where you first notice patterns worth investigating further, and where you can flag anything unusual (a suspiciously narrow spread of responses, for instance) before it affects your inferential analysis.
This step also tells you whether your data meets the assumptions required for the inferential tests you're planning next — for example, whether your key variables are roughly normally distributed, which determines whether you need parametric tests (like Pearson correlation or ANOVA) or non-parametric alternatives (like Spearman correlation or Mann-Whitney U).
Step 4: Choose the Right Inferential Test for Your Question
This is where many first-time scholars get stuck — not because the tests are conceptually hard, but because it's unclear which test answers which kind of question. Here's a practical mapping for the tests HR theses use most often:
- Correlation (Pearson or Spearman): Use this when your question is about the relationship between two continuous variables — for example, "is there a relationship between perceived organizational support and employee engagement scores?" Pearson assumes normally distributed data; Spearman is the non-parametric alternative when that assumption doesn't hold.
- Multiple regression: Use this when you want to know how well several independent variables together predict one outcome — for example, "how well do leadership style, compensation satisfaction, and work-life balance predict turnover intention?" Regression also tells you which predictors matter most, not just whether a relationship exists.
- Independent samples t-test: Use this to compare the means of two distinct groups — for example, comparing engagement scores between employees who work remotely versus those who work on-site.
- ANOVA (one-way or two-way): Use this when comparing means across three or more groups — for example, engagement scores across junior, mid-level, and senior employees.
- Logistic regression: Use this when your outcome variable is categorical rather than continuous — for example, predicting whether an employee is likely to leave (yes/no) based on several predictor variables.
In every case, report the actual statistic (the correlation coefficient, the regression coefficient, the F or t value) alongside the p-value, using the conventional 0.05 significance threshold most business research relies on — and be careful to describe a significant result as evidence of a relationship or difference, not as proof of causation, unless your research design specifically supports a causal claim (which most survey-based MBA theses don't).
A Quick Reference for Reporting Your Results
Once you've run the right test, how you report it matters almost as much as the test itself. A results paragraph that simply states "the results were significant" tells a reader nothing useful. A stronger version names the specific statistic, its value, and what it means in plain language — for example: "A Pearson correlation revealed a moderate positive relationship between perceived organizational support and employee engagement (r = .42, p < .01), suggesting that employees who feel more supported by their organization also report higher engagement levels." This format — statistic, direction, strength, significance, plain-language interpretation — is the standard structure examiners expect to see repeated consistently across your results chapter, and it's worth drafting a template sentence for each test type before you start writing so your reporting stays consistent throughout.
It's also worth deciding early how you'll present numeric output visually. A correlation matrix, a simple regression summary table, or a bar chart comparing group means communicates a finding far faster than a paragraph of narrated numbers — and most MBA HR examiners expect at least a few of these visual summaries alongside your narrative discussion, not instead of it.
Step 5: Analyzing Qualitative HR Data
If your thesis includes interviews, open-ended survey responses, or focus group data, quantitative statistics won't capture what that material is telling you. HR research benefits particularly from qualitative analysis because numeric engagement scores tell you what the engagement level is, while open-ended responses tell you why — the context that turns a number into an actionable finding.
Two common approaches:
- Thematic analysis involves reading through your qualitative material, coding recurring ideas, and grouping those codes into broader themes. For example, in a study on managerial change-readiness, initial codes like "unclear communication," "no advance notice," and "conflicting instructions" might all group into a broader theme of "communication breakdown during transitions." This is the most common qualitative approach in MBA HR theses because it's flexible across research questions and manageable within a thesis timeline.
- Content analysis takes a more structured, semi-quantitative approach — systematically categorizing text against a pre-defined framework and counting how often specific themes or terms appear. This works well when you want to track how frequently a concept (like "burnout" or "workload") shows up across a large volume of open-ended comments, effectively bridging qualitative insight with quantitative frequency data.
Whichever method you choose, document your coding process — how codes were developed, whether a second coder checked your coding for consistency, and how disagreements were resolved. This transparency is what separates a rigorous qualitative analysis from a loosely organized summary of quotes, and it's exactly the kind of methodological detail an examiner will look for.
If your thesis combines both approaches — a common design in HR research — be explicit in your methodology chapter about how the two data types relate to each other. Some scholars use qualitative findings to explain a quantitative result (why did engagement scores drop specifically in one department? — interview data reveals a leadership transition that the numbers alone wouldn't show). Others use qualitative interviews first, to build the survey instrument, then validate emerging themes quantitatively across a larger sample. Naming which sequence you followed, and why, turns a mixed-methods design from a vague gesture toward "using both" into a deliberate, defensible research strategy.
Step 6: Present Results Without Overstating Them
Once your analysis is complete, resist the temptation to over-claim. A significant correlation is evidence of an association, not proof that one variable causes the other. A qualitative theme that emerged from twelve interviews describes a pattern within that specific sample, not a universal truth about all employees in that industry.
Present your results clearly using tables and figures where appropriate — SPSS output tables adapted for readability, or a simple bar chart of mean engagement scores by department — and follow this with an honest discussion of what the pattern might mean, and where the limitations of your sample size, response bias, or method genuinely constrain your conclusions. Committees and examiners respond far better to appropriately cautious, well-supported claims than to confident overreach that the data doesn't actually support.
For citation formatting throughout your results and discussion chapters, APA 7th edition remains the current standard most MBA programs require — author-date in-text citations, with "et al." used for any source with three or more authors from the very first citation, and DOIs formatted as full hyperlinks whenever available.
Two Real Scenarios: Data Analysis Done Wrong, and Done Right
Scenario 1 — The thesis that had to redo its analysis. An MBA scholar studying the relationship between training programs and employee performance collected survey data from 150 employees but skipped reliability testing on the custom scale they'd built for "training satisfaction." Midway through writing the results chapter, their supervisor asked for the Cronbach's alpha score — which the scholar hadn't calculated. When they finally ran it, the alpha came back at 0.54, well below the acceptable threshold, revealing that several items weren't actually measuring the same underlying construct. The scholar had to remove three weak items, re-run the reliability analysis on the remaining set (which then reached an acceptable 0.76), and redo every downstream correlation and regression analysis that depended on that scale — adding roughly three weeks to the timeline that a five-minute reliability check at the start would have prevented.
Scenario 2 — The thesis that moved smoothly through analysis. A different scholar, studying leadership style and employee retention intention, built their reliability check into the very first week after data collection — before running any other analysis. Their Cronbach's alpha came back at 0.81, confirming the scale was sound. They then ran descriptive statistics, confirmed their key variables were normally distributed, and proceeded directly to multiple regression to test which leadership dimensions most strongly predicted retention intention. Because each step was sequenced correctly — reliability, then descriptives, then inferential testing — the results chapter came together in under two weeks, and the committee's feedback focused on interpretation and discussion rather than requesting the analysis be redone.
The difference in both cases wasn't the statistical technique — regression and correlation are the same either way. It was whether reliability was checked before the scholar built downstream analysis on top of an unvalidated instrument.
Common Mistakes First-Time MBA Scholars Make
- Skipping reliability testing on custom or adapted scales, then discovering the problem only after building an entire analysis on top of it.
- Choosing a statistical test based on what's familiar rather than what the question requires — running a t-test, for instance, when the research question actually calls for regression.
- Treating qualitative comments as an afterthought, summarizing a handful of quotes without a systematic coding process behind them.
- Overstating correlational findings as causal claims, a common and easily avoidable overreach in survey-based HR research.
- Not documenting the analysis process — which tests were run, why, and on what data — leaving the methodology chapter too vague for a reader to evaluate or replicate.
How Long Does Data Analysis Typically Take?
For a typical MBA HR thesis with a sample of roughly 100–300 survey respondents and a standard set of SPSS tests (reliability, descriptives, correlation or regression), data analysis generally takes a few focused weeks once data collection is complete — assuming the questionnaire and analysis plan were designed properly from the start. Skipping reliability testing or choosing the wrong test for your question is what typically extends this timeline, not the underlying statistical work itself.
If you'd like structured support running or interpreting your SPSS analysis, or building a coding framework for qualitative HR data, you can check out our MBA Thesis Assistance Service — our PhD-qualified mentors regularly work with MBA scholars at exactly this stage, from questionnaire design through to results interpretation.
For a full walkthrough of choosing the right methodology before you even collect your data, see our related guide, [Research Methodology Guide for MBA Human Resources Dissertations]. If you're still deciding on your broader research area, [Top MBA Thesis Topics in Operations for 2026] may also be useful as you scope your final topic.
FAQs
How do you analyze data for an MBA Human Resources thesis?
Start by confirming whether your design is quantitative, qualitative, or mixed-methods, then clean your data, test the reliability of any multi-item scales using Cronbach's alpha, run descriptive statistics, and apply the inferential test that matches your specific research question — correlation, regression, t-tests, or ANOVA for quantitative data, and thematic or content analysis for qualitative data.
Why should I analyze data carefully for an MBA HR thesis?
Because reliability and validity issues in your data — an unvalidated scale, a mismatched statistical test, or an unsystematic qualitative coding process — are among the most common reasons results chapters get sent back for revision, even when the underlying research idea is strong.
When should you analyze data for an MBA HR thesis?
Reliability testing should happen immediately after data collection, before any other analysis is built on top of the scale. Descriptive statistics come next, followed by inferential testing once you've confirmed your data meets the assumptions each test requires.
How long does it take to complete an MBA thesis using this approach?
Data analysis itself typically takes a few weeks for a standard MBA HR sample size once collection is complete. Skipping reliability checks or choosing the wrong statistical test is what most often extends this timeline through rework, not the analysis process itself.
Is professional help available to analyze data for an MBA HR thesis?
Yes. Academic mentoring services can help you choose the right statistical tests, run and interpret SPSS output, or build a qualitative coding framework — supporting your analysis process rather than replacing your own research and interpretation.
Strong data analysis in an MBA HR thesis isn't about running every statistical test available — it's about matching the right method to your specific research question, validating your instrument before you build on it, and presenting your findings honestly. If you'd like an experienced second opinion on your analysis plan, SPSS output, or qualitative coding approach, our team at ThesisLikho — PhD-qualified mentors who've supported thousands of MBA scholars through this exact stage — is here to help. Get Free MBA Thesis Consultation.