
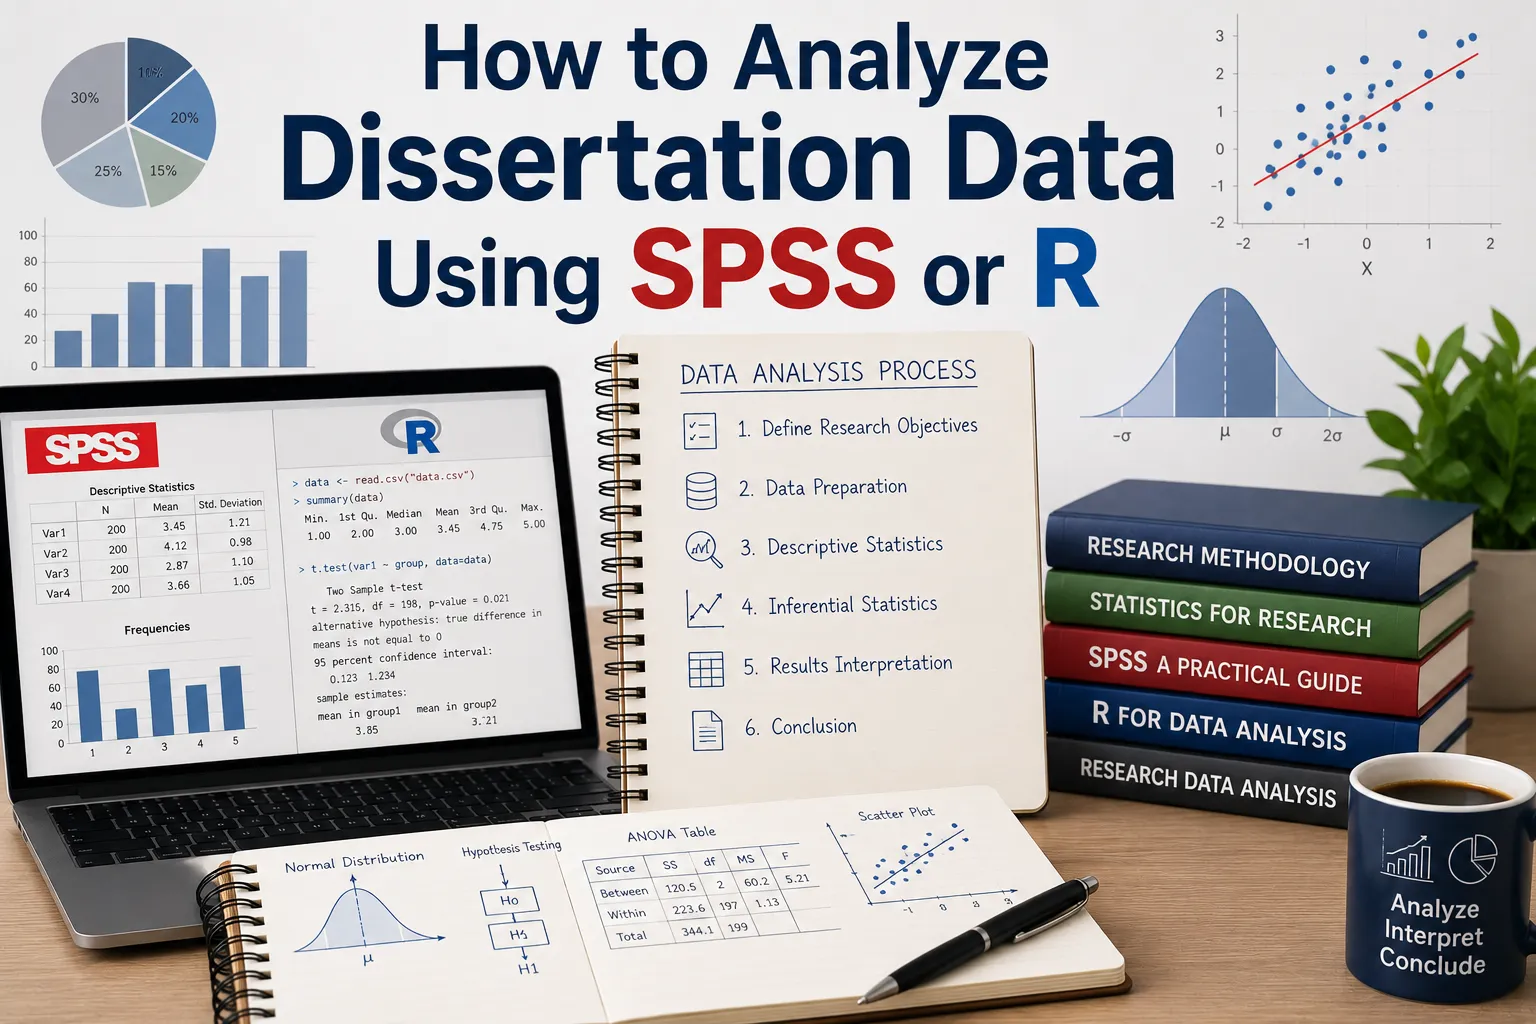
You've finished data collection. The literature review is written, the methodology chapter is approved, and now you're staring at a spreadsheet of survey responses wondering: SPSS or R, and then — once you've picked one — what do I actually do with it?
This guide walks through how to analyze dissertation data using SPSS or R the way an experienced research supervisor would: practically, without assuming you already know statistics jargon or how to code. If you're a first-time dissertation writer without a strong research background, this is written specifically with you in mind.
At ThesisLikho, our PhD-qualified mentors have guided more than 10,000 scholars through data analysis planning and execution across disciplines. What follows draws on that mentoring experience, checked against current comparative guidance on SPSS and R for academic research and established methodology resources referenced via Google Scholar.
One thing worth saying upfront: there's no universally "correct" choice between SPSS and R, and scholars sometimes lose real time agonizing over this decision instead of just making one, defensibly, and moving forward. Both tools, used correctly, produce the same statistical results for standard dissertation analyses — what actually determines the quality of your results chapter is whether you checked your assumptions, chose the right test for your question, and reported your findings clearly, not which software's logo appears in your methodology chapter.
1. SPSS or R: How to Actually Decide
This is usually the first real fork in the road, and the honest answer is that both tools produce equivalent results for standard dissertation-level analyses — regression, ANOVA, correlation, factor analysis — so the decision usually comes down to your discipline's norms, your comfort with coding, and what your university actually supports.
SPSS is menu-driven, requires no coding, and remains the standard choice across Indian management, education, psychology, and social science programmes, largely because supervisors are familiar with it and it produces clean, publication-formatted tables and charts with minimal setup. Its main limitations are cost (though most universities provide institutional licenses) and less flexibility for highly customized or advanced statistical modeling.
R (typically used through the RStudio/Posit interface) is free, open-source, and increasingly the expected standard in STEM fields, ecology, and computational social science — some top journals in these areas now expect R code submitted alongside data for reproducibility. It's considerably more powerful for large datasets, custom visualizations, and advanced modeling, but it has a real learning curve — expect several weeks of active learning before you're comfortable, especially if you have no prior coding experience.
A few practical decision points:
- Check what your department actually teaches and supports. If your university runs SPSS workshops and your supervisor uses SPSS, fighting that norm to use R adds friction without necessarily strengthening your dissertation.
- Consider your field's disciplinary expectations. SPSS remains dominant in Indian management, education, and social science research; R is increasingly expected in psychology, ecology, and any STEM-adjacent quantitative field, particularly if you're aiming to publish in international journals.
- Be honest about your timeline. If you're already several months from submission and have never coded, committing to learning R from scratch adds real risk — SPSS's point-and-click interface gets you to results faster if time is tight.
- Consider your post-dissertation goals. If you're planning further academic research or a data-adjacent career, investing the time in R now pays off longer-term, since it's free, more powerful, and increasingly the norm in top-tier publishing.
Whichever you choose, note that the choice itself is a methodological decision that belongs in your methodology chapter — briefly stating why you chose your tool (familiarity, disciplinary norm, or specific analytical need) shows deliberate reasoning rather than a default choice, and gives you a ready answer if a committee member asks about it at viva.
2. Getting Your Data Ready Before You Open Either Tool
Before running a single test, your data needs cleaning — skipping this step is one of the fastest ways to produce results you can't actually defend:
- Check for missing data and decide, explicitly, how you'll handle it (listwise deletion, mean imputation, or a more sophisticated method) — and state your chosen approach in your methodology chapter, since an unexplained pattern of missing responses is one of the first things an examiner notices.
- Screen for outliers using boxplots or z-scores, and decide whether to remove, transform, or retain them, with a stated rationale either way.
- Verify your variable coding is consistent — reverse-coded survey items need to be flipped before analysis, and Likert-scale variables should be coded numerically in a way that matches your intended direction of interpretation.
- Label your variables and value labels clearly (especially in SPSS, where this directly affects how your output tables read) — this small step saves considerable confusion when you return to your dataset weeks later during results-chapter writing.
- Keep a raw, untouched copy of your original dataset separate from your cleaned working file — if a reviewer or examiner questions a data-cleaning decision, you need to be able to show exactly what was changed and why.
3. Core Statistical Tests Every Dissertation Scholar Should Know
Most dissertation-level quantitative analysis draws from a fairly small toolkit. Knowing which test answers which kind of question is more important than knowing how to run all of them:
- Descriptive statistics (means, frequencies, standard deviations) — your starting point for every quantitative dissertation, used to summarize your sample before testing any relationships.
- T-tests — for comparing means between two groups (e.g., comparing satisfaction scores between two departments).
- ANOVA — for comparing means across three or more groups, with post-hoc tests to identify which specific groups differ.
- Correlation analysis — for testing the strength and direction of a relationship between two continuous variables, without implying causation.
- Regression analysis — for testing whether one or more predictor variables explain variation in an outcome variable; the most commonly used technique for hypothesis-driven dissertation research.
- Chi-square tests — for testing relationships between categorical variables.
- Factor analysis — for identifying underlying structure among a large set of survey items, commonly used when validating or reducing a multi-item scale.
Both SPSS and R run every one of these tests equally well — the decision of which test to use should come from your research question and hypotheses, established back in your methodology chapter, not from which software makes a particular test easier to click through.
A simple way to check yourself: state your hypothesis in plain language first ("scores differ between two groups," "these two variables move together," "this set of predictors explains variation in an outcome"), and let that sentence point you to the matching test — two-group comparison points to a t-test, multi-group comparison points to ANOVA, a relationship between two continuous variables points to correlation, and a predictive or explanatory claim points to regression. If you find yourself unsure which test your hypothesis calls for, that's usually a sign to revisit your methodology chapter's framing before touching any software at all.
4. Analyzing Your Data in SPSS: A Practical Walkthrough
SPSS's core strength for a first-time researcher is that its menu-driven interface — Analyze, then the relevant submenu (Compare Means, Regression, Correlate, and so on) — lets you run standard tests without writing code, and it automatically generates tables and charts formatted close to academic publication standards, which saves considerable time when building your results chapter.
A practical workflow:
- Import and clean your data, checking variable types (nominal, ordinal, scale) are correctly assigned, since SPSS uses this to determine which tests are even available to you.
- Run descriptive statistics first, always — this catches data entry errors and gives you a sense of your sample before you test anything.
- Check your test's assumptions (covered in Section 6) before running the main analysis — SPSS provides diagnostic output for this within most test dialogues.
- Run your planned test, and export the output table directly rather than retyping values manually into your thesis, which introduces transcription errors.
- Save your SPSS syntax file alongside your output, even if you used the point-and-click menus — SPSS can auto-generate syntax from your menu selections (via the "Paste" button in most dialogue boxes), and keeping this record is what lets you or an examiner reproduce your exact analysis later, a genuine reproducibility gap that pure menu-based use otherwise creates.
5. Analyzing Your Data in R: A Practical Walkthrough
R's core strength is flexibility and reproducibility — because every step is written as code, your entire analysis is automatically documented and re-runnable, which is exactly why journals in fields like ecology, epidemiology, and psychology increasingly expect R code submitted alongside published results.
A practical workflow for a first-time R user:
- Install R and RStudio (the standard, more accessible interface for R) rather than working in base R directly.
- Import your data using a package like
readrorhaven(the latter is particularly useful if your data started in SPSS format, since it preserves SPSS variable and value labels). - Clean and prepare your data using the
tidyversecollection of packages (particularlydplyrfor data manipulation), which has a much gentler learning curve than base R syntax for common data-cleaning tasks. - Run descriptive statistics and assumption checks before your main analysis, using packages like
psychor base R summary functions. - Run your planned test — common packages include base R for t-tests and ANOVA,
lm()for regression, and specialized packages (likelavaanfor structural equation modeling orpsychfor factor analysis) for more advanced techniques. - Save your full R script, well-commented, alongside your output — this script itself is your reproducibility record, and increasingly, some supervisors or examiners may ask to see it directly.
Budget real time for the learning curve if you're new to R — expect several weeks of active practice before you're comfortable running your core analyses independently, and don't leave this learning phase until close to your submission deadline.
6. Checking Your Assumptions Before You Trust Your Results
Every standard statistical test rests on assumptions, and skipping this check is one of the most common, most consequential errors in dissertation data analysis — running a regression while ignoring homoscedasticity or multicollinearity, for instance, can lead directly to incorrect conclusions that still look statistically clean on the surface.
Common assumptions to check, depending on your test:
- Normality — many parametric tests (t-tests, ANOVA, regression) assume your data is roughly normally distributed; check this with a Shapiro-Wilk test or a visual Q-Q plot, and know your non-parametric alternatives (Mann-Whitney U, Kruskal-Wallis) if normality is seriously violated.
- Homogeneity of variance — for t-tests and ANOVA, check with Levene's test; violations don't necessarily invalidate your results but usually require adjusted test statistics.
- Linearity — for correlation and regression, check with scatterplots before assuming a linear relationship exists.
- Multicollinearity — for multiple regression, check variance inflation factors (VIF); highly correlated predictors can distort your regression coefficients in misleading ways.
- Independence of observations — most tests assume your data points are independent; repeated-measures or nested data (e.g., students within classrooms) need different modeling approaches (like mixed-effects models) if this assumption doesn't hold.
Report these checks explicitly in your results chapter, even briefly — "assumptions of normality and homogeneity of variance were tested and met/violated, and [action taken]" is a short sentence that signals real methodological rigor to an examiner, and its absence is one of the fastest ways to draw pointed viva questions.
7. Reliability and Validity Checks
If your dissertation uses a multi-item survey scale, reliability testing is expected, not optional:
- Cronbach's alpha is the standard measure of internal consistency for a scale — both SPSS (via Analyze > Scale > Reliability Analysis) and R (via the
psychpackage'salpha()function) compute this easily. A commonly cited acceptable threshold is above 0.70, though this varies somewhat by field and scale type. - Factor analysis (exploratory or confirmatory) is used to validate that your survey items actually measure the underlying construct(s) you intend, particularly important if you've adapted or combined items from multiple prior scales rather than using a single validated instrument wholesale.
- Report both the coefficient and your interpretation — simply stating "Cronbach's alpha was 0.82" without a sentence on what that means for your scale's reliability is a common, easily fixed gap in dissertation results chapters.
8. Reporting Your Results the Way Examiners Expect
- Follow your citation style's statistical reporting conventions (commonly APA) — this specifies exact formatting for reporting test statistics, degrees of freedom, p-values, and effect sizes, and inconsistent formatting here is an easy, avoidable flag.
- Always report effect sizes alongside significance, not just p-values — a statistically significant result with a tiny effect size tells a very different story than one with a large effect size, and examiners increasingly expect both.
- Use tables and figures generated directly from your software output rather than manually retyping numbers, which introduces transcription risk.
- Connect every result back to your original research question or hypothesis explicitly — a results chapter that presents test outputs without interpreting what they mean for your specific research question reads as a list of statistics rather than a coherent argument.
- Report non-significant results too, where relevant to your hypotheses — selectively reporting only significant findings is a well-documented research integrity concern, and a thorough results chapter reports what the data actually showed, not just what supports your expected outcome.
For a fuller walkthrough of structuring this chapter, see How to Write the Methodology Chapter of a Thesis.
9. Common Mistakes First-Time Dissertation Writers Make
- Choosing a statistical test without checking its assumptions first, then discovering during viva preparation that the test wasn't actually appropriate for the data.
- Running dozens of tests and reporting only the significant ones — a practice known as p-hacking, which undermines the credibility of your entire results chapter if detected.
- Treating software output as self-explanatory — pasting a table into your thesis without interpretive prose explaining what it means leaves the reader (and examiner) to do the analytical work you should have done yourself.
- Not keeping a syntax file or R script, making it difficult or impossible to reproduce your own analysis if a committee member asks a follow-up question or if you need to rerun something after a data correction.
- Skipping reliability testing for adapted survey scales, assuming a previously validated instrument remains equally reliable when translated, shortened, or adapted for a new context.
- Choosing software based purely on availability without stating a rationale — this isn't disqualifying, but failing to have a ready explanation if asked at viva is an easily avoidable gap.
- Underestimating the R learning curve if new to coding, and starting this learning process too close to the submission deadline.
10. Two Realistic Case Studies
Case Study 1 — Choosing SPSS for a Time-Constrained Management Dissertation
A dissertation scholar with no prior coding experience and a tight six-month data-analysis timeline was initially drawn to R after reading about its growing academic prestige. After an honest assessment of the learning curve against the remaining timeline, and confirming their department's standard software was SPSS with strong supervisor familiarity, the scholar chose SPSS instead. Using SPSS's menu-driven workflow, paired with saved syntax files for reproducibility, the scholar completed a full regression-based analysis — including assumption checks and reliability testing for an adapted survey scale — well within the remaining timeline, without the added risk of an unfamiliar coding environment.
Case Study 2 — Choosing R for a STEM-Adjacent Dissertation Targeting Publication
A first-time dissertation scholar in an environmental science-adjacent field, aiming to eventually publish findings in an international journal, chose R despite having no prior coding background, recognizing that the target journals in their field increasingly expected R code submitted alongside results. The scholar budgeted six weeks of dedicated learning time early in the analysis phase, working through the tidyverse for data cleaning before attempting more advanced modeling. The upfront time investment paid off: the resulting analysis was fully reproducible via a well-commented R script, which strengthened both the dissertation's methodological rigor and its readiness for eventual journal submission.
If you're navigating this decision or need help executing your analysis correctly, our Dissertation Writing service can help you choose the right tool and run a defensible, well-documented analysis.
FAQs
How do I analyze dissertation data using SPSS or R?
Start by cleaning your data and confirming your test assumptions, then run the specific statistical test that matches your research question (t-test, ANOVA, correlation, regression, or factor analysis) using either SPSS's menu-driven interface or R's script-based workflow, and report both the test statistic and effect size clearly connected back to your hypothesis.
Why should I care about analyzing dissertation data using SPSS or R correctly?
Because an incorrectly run or unchecked analysis can produce results that look clean but are actually invalid — skipped assumption checks or an inappropriate test choice are among the most common reasons a results chapter draws serious questions at viva.
When should you analyze dissertation data using SPSS or R, relative to your other chapters?
Data analysis should begin as soon as data collection is complete and cleaned, ideally before you finalize your results chapter structure, since your actual findings — not just your planned analysis — should shape how that chapter is organized.
How long does it take to complete a dissertation using this approach?
Timelines vary, but SPSS-based analysis is typically faster to execute for scholars without coding experience, while R requires a genuine upfront learning investment (commonly several weeks) that pays off in reproducibility and, for some fields, stronger publication readiness.
Is professional help available to analyze dissertation data using SPSS or R?
Yes — support with choosing the right statistical approach, running assumption checks, and executing a defensible analysis in either SPSS or R is available through services such as Dissertation Writing.
Ready to get your dissertation data analysis done right, the first time? Get Dissertation Help Now from ThesisLikho's PhD-qualified mentors.