
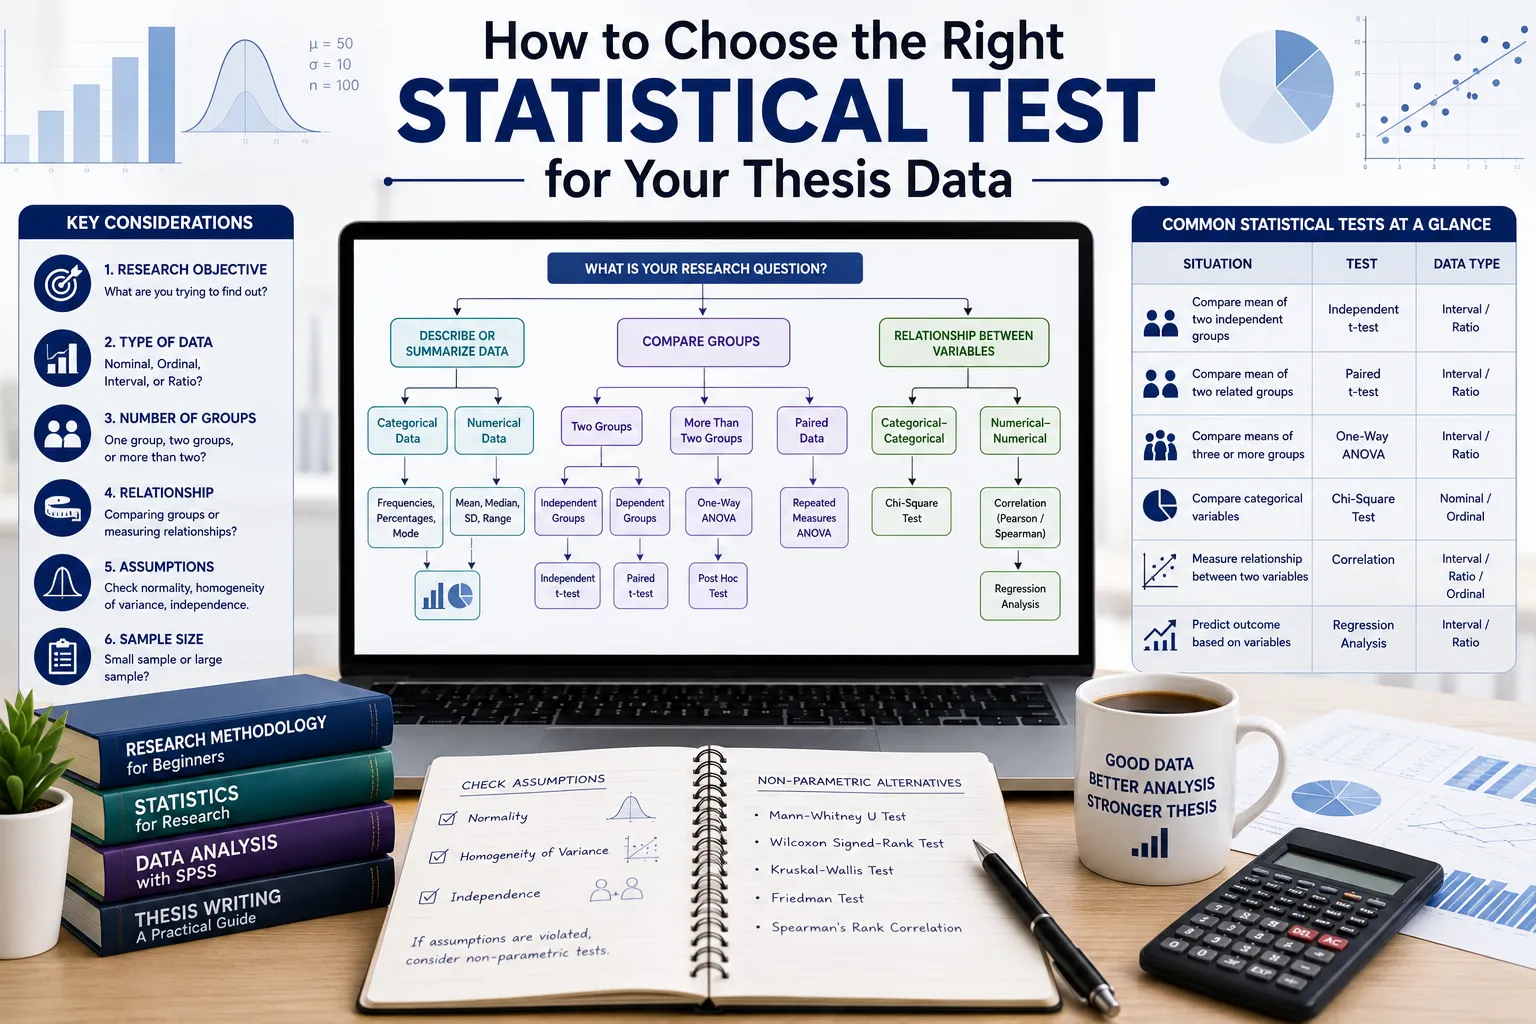
Staring at your cleaned dataset and wondering which statistical test to run next is a genuinely common moment of paralysis in thesis writing. There are dozens of tests, each with its own name, assumptions, and use case, and picking the wrong one doesn't just produce a wrong answer — it can produce a confident-looking, completely misleading one. This guide walks through how to choose the right statistical test for your thesis data using a structured decision process, rather than guesswork or habit.
Choosing a statistical test is a structured decision, not guesswork. It comes down to fixing your research goal, counting and classifying your variables, identifying each variable's level of measurement, and checking the key assumptions that determine which test family applies — independence of observations, homogeneity of variance, and normality.
Step 1: Clarify Your Research Goal First
Before looking at a single test name, be clear about what your research question is actually asking. Broadly, thesis-level statistical questions fall into two categories: comparing groups (is there a difference between conditions, categories, or time points?) or testing relationships (is there an association or predictive relationship between variables?). Get this distinction clear first — it immediately narrows your options considerably.
Step 2: Identify Your Variable Types and Measurement Levels
Classify each relevant variable by its level of measurement:
- Nominal — categories with no inherent order (e.g., gender, department, region)
- Ordinal — categories with a meaningful order but unequal intervals (e.g., Likert-scale responses, education level)
- Interval/Ratio (continuous) — numeric data with meaningful, equal intervals (e.g., age, income, test scores)
This classification directly determines which tests are even mathematically appropriate for your data, before you get to distributional assumptions.
Step 3: Check Whether Your Data Meets Parametric Assumptions
Parametric tests are used when data are assumed to follow a specific distribution, usually normal — common examples include the t-test, ANOVA, and regression analysis. Non-parametric tests are used when no such assumption is made, when your data don't meet normality or homogeneity of variance requirements, or when your data are ordinal rather than continuous. Non-parametric tests are also generally more reliable when working with small sample sizes.
The first practical step in this check is examining normality, often starting with a simple histogram inspection — statistical tests for normality and visual inspection together give a more reliable picture than either approach alone. Look specifically for skewness, heavy tails, bimodality, or substantial outliers. If normality is clearly in doubt, using a parametric test anyway will produce seriously misleading results, regardless of how correctly you run the rest of the analysis.
A genuinely useful sample-size guideline for this decision: with more than 30 observations per group, the Central Limit Theorem provides enough robustness that parametric tests are usually safe even with mild non-normality. With fewer than 15 observations per group, distributional assumptions matter considerably more, and with fewer than 10, defaulting to a non-parametric test is the safer choice unless the variable is known to be normal from established prior research in your field.
Step 4: Follow the Decision Sequence for Comparing Groups
If your research goal involves comparing groups, work through this sequence:
- Two groups, parametric assumptions met → independent samples t-test (unrelated groups) or paired samples t-test (same group measured twice)
- Two groups, parametric assumptions not met → Mann-Whitney U test (unrelated groups) or Wilcoxon signed-rank test (paired data)
- More than two groups, parametric assumptions met → ANOVA
- More than two groups, parametric assumptions not met → Kruskal-Wallis test
Step 5: Follow the Decision Sequence for Testing Relationships
If your research goal involves testing relationships between variables, the sequence looks different:
- Two continuous variables, linear relationship, normally distributed → Pearson correlation
- Ordinal data, non-normal data, or a monotonic (but not necessarily linear) relationship → Spearman's rho
- Small samples with many tied ranks specifically → Kendall's tau is generally preferred over Spearman
- Predicting a continuous outcome from one or more predictors → linear or multiple regression
- Predicting a categorical outcome → logistic regression
- Two categorical variables → chi-square test of independence
Step 6: Don't Default to Non-Parametric "Just to Be Safe"
It's tempting, especially for beginners, to assume non-parametric tests are always the "safer" choice since they make fewer assumptions. This isn't quite right: non-parametric tests are generally less statistically powerful than parametric tests at detecting true effects when they genuinely exist. In other words, defaulting to non-parametric tests reflexively can actually make you less likely to detect a real effect in your data. Choose based on whether your specific parametric assumptions are actually met, not out of general caution.
Step 7: Consider Your Sample Size Alongside Your Test Choice
Sample size interacts directly with your test choice. Smaller samples generally favor non-parametric tests like Mann-Whitney U or Fisher's exact test, since these don't rely on normality assumptions that small samples struggle to satisfy convincingly. Larger samples make parametric tests like t-tests, ANOVA, and regression more robust and generally preferred. In either case, conducting a power analysis is worth doing to confirm your sample size is actually sufficient to detect a meaningful effect — a sample too small risks false negatives, while an excessively large sample can flag trivial, practically meaningless differences as statistically significant.
Step 8: Report Your Results Completely, Not Just the Test Outcome
A complete, defensible statistical report requires more than the bare test result. Include the test statistic with its degrees of freedom, the exact p-value, an effect size with a 95% confidence interval, and a clear statement of the direction and magnitude of the effect. Selecting the wrong statistical test, and reporting results incompletely, are both more common in published research than most researchers admit — giving your committee the complete picture protects you from exactly this kind of scrutiny.
Step 9: Record and State Your Reasoning Explicitly
Once you've worked through the decision process and arrived at your chosen test, write down your reasoning explicitly in your methodology or results chapter — not just which test you used, but why: your variable types, your sample size, your normality check results, and why the chosen test was the appropriate match given all of these. Reviewers and examiners will ask why you selected this specific test over plausible alternatives, and having this reasoning already documented turns a potentially awkward defense moment into a straightforward confirmation.
Practical Checklist: Have You Chosen the Right Statistical Test?
- Research goal (comparing groups vs. testing relationships) is clearly identified
- Each relevant variable's measurement level (nominal, ordinal, continuous) is classified
- Normality has been checked through both visual inspection and formal testing
- Sample size per group has been considered relative to the 30/15/10 rule of thumb
- The correct decision sequence (comparing groups or testing relationships) has been followed to its specific test
- Non-parametric tests weren't chosen by default without checking whether parametric assumptions were actually met
- A power analysis has been considered to confirm sample size adequacy
- Results will be reported with test statistic, degrees of freedom, exact p-value, effect size, and confidence interval
- Reasoning for the chosen test is documented explicitly, ready to defend if questioned
Two Practical Scenarios
Scenario 1 — Choosing Between a t-test and Mann-Whitney U A scholar comparing job satisfaction scores between two departments had a sample of 22 respondents per group. Checking normality through both a histogram and a formal normality test revealed a moderately skewed distribution, and with fewer than 30 observations per group, the Central Limit Theorem couldn't be relied on to provide sufficient robustness. Rather than defaulting to the more familiar independent samples t-test, the scholar switched to the Mann-Whitney U test, explicitly documenting the normality check results and sample size as the reasoning behind this choice in the methodology chapter.
Scenario 2 — Avoiding an Unnecessarily Conservative Test Choice A scholar with a large sample of 250 respondents initially assumed a non-parametric test would be the "safer" choice for comparing three groups, despite the data showing only mild, non-problematic deviation from normality. After reviewing the guidance that non-parametric tests are generally less powerful at detecting real effects, and recognizing that a sample this large provides strong robustness against mild non-normality, the scholar chose ANOVA instead — a more powerful test appropriately justified by the large sample size, rather than an overly cautious default.
Common Mistakes Thesis Writers Make When Choosing Statistical Tests
- Choosing a test based on familiarity rather than matching it to the specific research goal, variable types, and distributional characteristics of the data.
- Skipping the normality check entirely and assuming parametric tests are always appropriate.
- Defaulting to non-parametric tests "to be safe" without checking whether parametric assumptions were actually violated.
- Ignoring sample size when deciding between parametric and non-parametric options.
- Reporting only the p-value without the test statistic, degrees of freedom, effect size, and confidence interval that a complete statistical report requires.
Frequently Asked Questions
How do you choose the right statistical test for your thesis data?
Start by clarifying your research goal (comparing groups or testing relationships), classify your variables by measurement level, check whether your data meets parametric assumptions (particularly normality), and then follow the appropriate decision sequence to arrive at a specific test matched to your variable types, sample size, and research question.
Why does choosing the right statistical test matter for a thesis?
Selecting an inappropriate test can produce misleading results even when the analysis itself is run correctly — a mismatch between your data's characteristics and your chosen test's assumptions undermines the credibility of your findings regardless of how sophisticated the analysis appears.
How does statistical test selection affect a thesis's overall data analysis chapter?
A well-justified test choice, documented with clear reasoning about variable types, sample size, and assumption checks, gives examiners confidence in your findings; an unexplained or mismatched choice is one of the more common reasons a data analysis chapter draws committee scrutiny.
When should you choose the right statistical test for a thesis?
Ideally once your data has been cleaned and your variables' measurement levels and distributional properties are known — choosing a test too early, before checking these characteristics, risks having to redo the analysis later.
Is professional help available to choose the right statistical test for your thesis data?
Yes. ThesisLikho's PhD-qualified experts have guided 10,000+ scholars through statistical test selection, data analysis planning, and complete thesis writing assistance tailored to individual research designs.
Get Expert Guidance on Choosing Your Thesis Statistical Test
Selecting the right statistical test takes more than knowing test names — it requires matching your specific research goal, variable types, sample size, and distributional characteristics to the correct method, and being ready to defend that choice. If you'd like expert input on selecting and justifying the right statistical test for your thesis data, ThesisLikho's PhD-qualified team offers statistical analysis planning support, test selection guidance, and complete thesis writing assistance. If you need expert guidance with your data analysis, test selection, or overall results chapter, you can explore our Thesis Writing Assistance service.
Talk to a Thesis Expert → https://thesislikho.com/writing-services/thesis-writing