
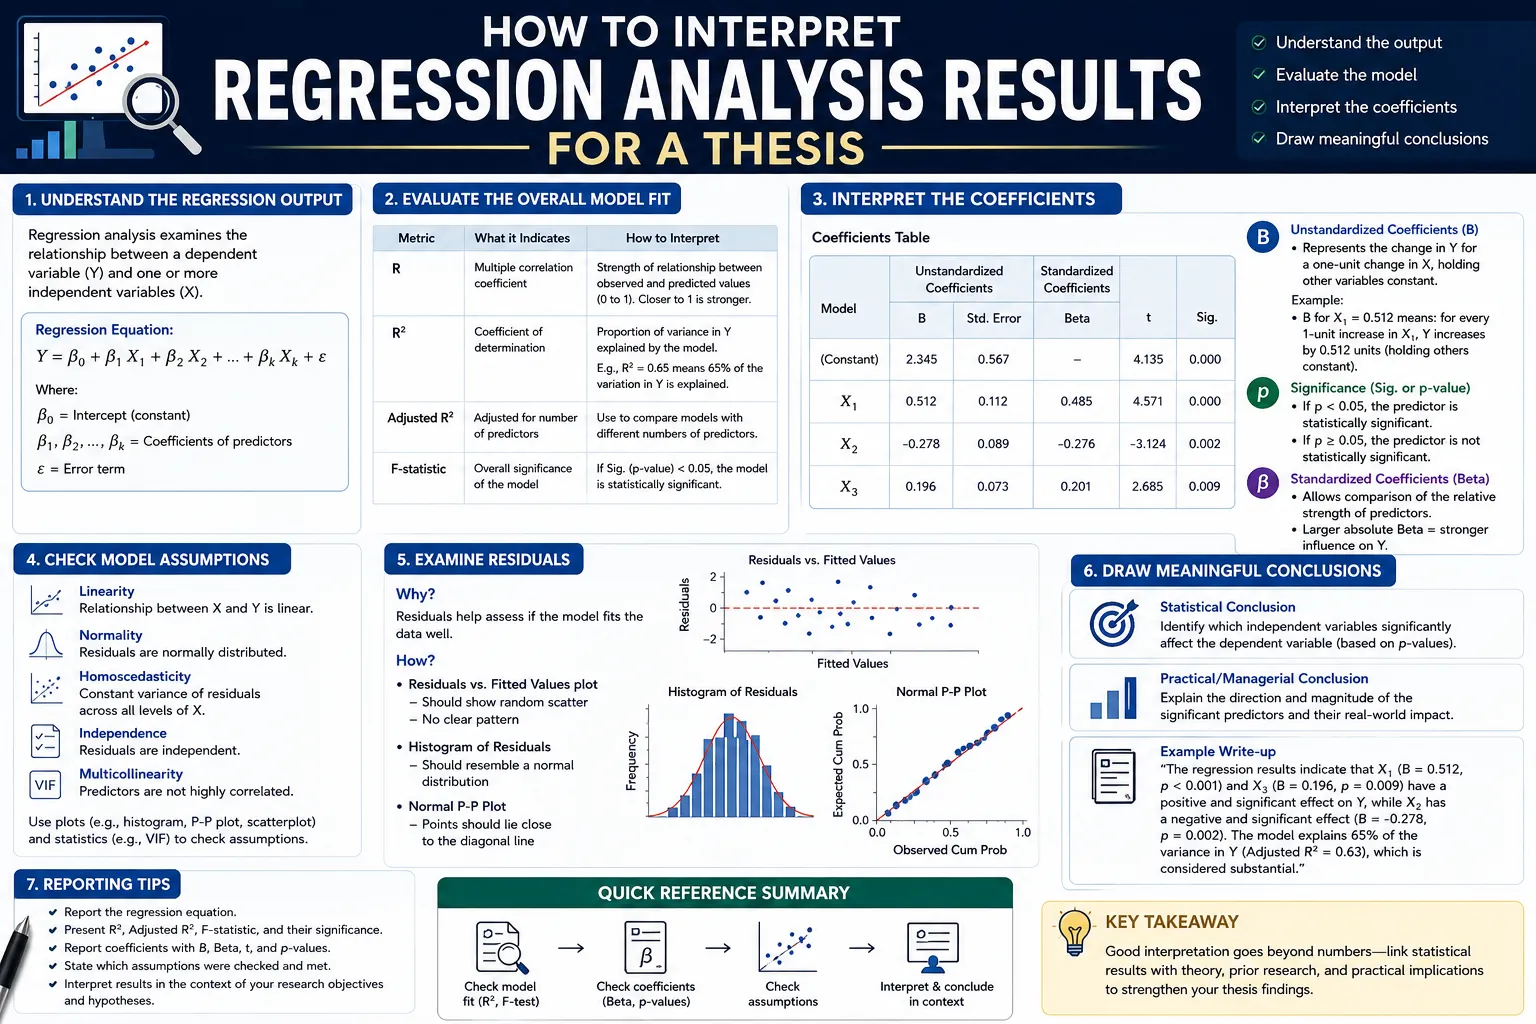
Running a regression in SPSS or Jamovi takes a few clicks. Interpreting the output correctly — and writing it up in a way that survives committee scrutiny — is where most of the real work happens. This guide walks through how to interpret regression analysis results for a thesis, covering assumption checks, coefficient interpretation, and the specific reporting details examiners look for first.
Check Your Assumptions Before You Trust Your Output
Before interpreting any regression output, key assumptions must be systematically checked: normality of residuals, homoscedasticity, and absence of multicollinearity. Running regression without checking these is described as the single most serious and frequent error in applied regression analysis — and it's a completely avoidable one. Skipping this step doesn't just weaken your write-up; it can genuinely invalidate the results you go on to interpret.
Checking Normality of Residuals
Normality of residuals can be checked visually with a histogram or Q-Q plot, or more formally with a goodness-of-fit test such as Kolmogorov-Smirnov. On a Q-Q plot, points should follow the diagonal line closely if the assumption is reasonably met. This isn't a purely cosmetic check — if residuals are not normal, the confidence intervals and p-values your model produces become unreliable, meaning everything you interpret afterward is standing on shaky ground.
Checking Homoscedasticity
Homoscedasticity is checked via a scatterplot of residuals against predicted values. An ideal plot shows data scattered without an obvious pattern — points roughly evenly distributed above and below zero, with no discernible shape. A funnel or cone-shaped pattern, tight on one side and wide on the other, signals heteroscedasticity, a violation of this assumption that, like non-normal residuals, undermines the reliability of your significance tests.
Checking for Multicollinearity
Multicollinearity — when your independent variables are too highly correlated with each other — is often described as the assumption that can quietly destroy an entire multiple regression analysis. When predictors are too highly correlated, coefficients become unstable, standard errors inflate, and results can flip sign without warning, undermining the very interpretation you're trying to build.
Check multicollinearity two ways: first, build a correlation matrix among your predictors, where coefficients nearing or exceeding .80 suggest a problem. Second, and more formally, check Variance Inflation Factor (VIF) values for each predictor. A widely used threshold treats VIF values below 5 as minimal concern, values above 5 as raising real concern, and values above 10 as signaling significant multicollinearity that needs to be addressed — often by removing or combining the affected predictors.
This check matters enough that experienced reviewers are known to look at VIF values before they even look at p-values. A VIF table can be a genuine tipping point for how your results chapter is received — no number of individually significant predictors can compensate for a model built on collinear variables.
Checking for Influential Outliers
Beyond the three core assumptions, check for influential outliers using diagnostics such as Cook's distance. Values above 1.0 (some researchers use a stricter threshold of 0.5) may indicate influential cases worth investigating and, if genuinely problematic, addressing before finalizing your model.
Interpreting the Core Regression Output
Once your assumptions check out, move to interpreting the actual results. A standard, complete reporting format for multiple regression includes model fit statistics, the F-value, R² (and adjusted R²), individual coefficients, standard errors, p-values, and effect sizes. Omitting any of these leaves your reader unable to fully evaluate your model.
Start With Overall Model Fit
Before interpreting any individual predictor, confirm the model as a whole is statistically significant — this is where the F-value and its associated significance come in. If the overall model isn't significant, discussing individual predictor coefficients in depth becomes much harder to justify.
Report R² — and Adjusted R² Alongside It
R² measures the proportion of variance in your dependent variable explained by your independent variables. Reporting only unadjusted R² is a commonly flagged error, since unadjusted R² inflates explained variance, especially as more predictors are added to the model. For multiple regression specifically, report adjusted R² alongside (or instead of) the raw figure, since it corrects for the number of predictors and gives a more honest picture of your model's actual explanatory power.
Understand the Difference Between B and Beta
A frequent point of confusion for thesis writers: B is the raw, unstandardized coefficient, expressed in the original units of your variable (for example, "a one-unit increase in X is associated with a B-unit change in Y"). Beta (β) is the standardized coefficient, used specifically for comparing the relative strength of different predictors within the same model, since it puts all predictors on the same standardized scale regardless of their original units. Both should be reported — B for meaningful, real-world interpretation, and Beta for comparing which predictor has the strongest relative influence.
Interpret Direction and Magnitude, Not Just Significance
Interpretation requires reading both the direction (positive or negative) and magnitude of each coefficient, not just whether it's statistically significant. A coefficient can be statistically significant but practically trivial in size, or it can be large and meaningful but fail to reach conventional significance thresholds in a small sample — your write-up should address both dimensions rather than treating "significant" and "not significant" as the whole story.
Watch Your Language: Association, Not Causation
Regression describes statistical association, not causation. Without an experimental design, your findings cannot be interpreted as demonstrating a causal effect, no matter how intuitive the underlying relationship feels. Use careful, non-causal language throughout your interpretation — "is associated with," "predicts," or "is related to" — rather than "causes" or "leads to," unless your specific research design (such as a randomized experiment) genuinely supports a causal claim.
Choose Your Predictor Entry Method Deliberately
The Enter method — entering all theoretically justified predictors together in a single step — is generally recommended over Stepwise regression for thesis-level work. Stepwise methods are exploratory and produce poorly replicable results, since the specific predictors retained can shift depending on minor variations in the dataset. Predictors should be selected based on the theoretical framework established in your literature review, not an automated statistical selection procedure that a future researcher couldn't reliably reproduce.
Step-by-Step: Interpreting Your Regression Output
- Check normality of residuals via Q-Q plot or a formal normality test
- Check homoscedasticity via a residuals-vs-predicted-values scatterplot
- Check multicollinearity via correlation matrix and VIF values
- Check for influential outliers using Cook's distance
- Confirm overall model significance via the F-value before interpreting individual predictors
- Report R² and adjusted R² together, not R² alone
- Report both B (unstandardized) and Beta (standardized) coefficients for each predictor
- Interpret each significant predictor's direction and magnitude, not just its p-value
- Use association-based language throughout, avoiding causal claims unless your design supports them
- Confirm your predictor selection method (Enter, based on theory) is stated and justified
Practical Checklist: Is Your Regression Interpretation Complete?
- Normality of residuals checked and reported (Q-Q plot or formal test)
- Homoscedasticity checked and reported (residuals scatterplot)
- Multicollinearity checked via both correlation matrix and VIF values
- Influential outliers checked via Cook's distance
- Overall model significance (F-value) confirmed before interpreting individual predictors
- Both R² and adjusted R² reported for multiple regression
- Both B and Beta coefficients reported for each predictor
- Direction and magnitude interpreted for each predictor, not just significance
- Language throughout uses association-based framing, not causal claims
- Enter method used with theoretically justified predictors, not unexplained Stepwise selection
- All assumption violations, if any, are disclosed transparently with their implications discussed
Two Practical Scenarios
Scenario 1 — Catching Multicollinearity Before It Undermined the Model
A scholar running a multiple regression predicting employee turnover intention from job satisfaction, salary satisfaction, and overall compensation satisfaction found a VIF of 12.4 for the compensation satisfaction variable. Recognizing this exceeded the threshold signaling significant multicollinearity, the scholar checked the correlation matrix and found compensation satisfaction was correlated at .87 with salary satisfaction — essentially measuring overlapping constructs. Combining the two into a single composite variable resolved the multicollinearity issue and produced more stable, interpretable coefficients in the final model.
Scenario 2 — Correcting Overstated Causal Language
A scholar's initial results write-up stated, "Increased managerial support causes higher employee retention." Since the study used a cross-sectional survey design rather than an experiment, this causal claim wasn't supported by the methodology. The scholar revised the language to "managerial support was significantly associated with higher employee retention intentions (β = .42, p < .001)," accurately reflecting what a non-experimental regression design can and cannot claim — a change that satisfied a committee member's specific concern about overstated causal interpretation.
Common Mistakes Thesis Writers Make Interpreting Regression Results
- Skipping assumption checks entirely and interpreting output as if it were automatically trustworthy.
- Reporting only unadjusted R², overstating the model's actual explanatory power.
- Confusing B and Beta, or reporting only one when both serve distinct interpretive purposes.
- Interpreting significance without discussing direction and magnitude, leaving the practical meaning of a finding unclear.
- Using causal language ("causes," "leads to") when the research design only supports association-based claims.
Frequently Asked Questions
How do you interpret regression analysis results for a thesis?
Start by checking key assumptions (normality of residuals, homoscedasticity, absence of multicollinearity), confirm overall model significance via the F-value, report R² alongside adjusted R², interpret both B and Beta coefficients for direction and magnitude, and use association-based rather than causal language throughout.
Why does correctly interpreting regression results matter for a thesis?
Misinterpreting regression output — skipping assumption checks, overstating causal claims, or reporting incomplete statistics — can undermine an otherwise well-designed study and is one of the most common reasons a quantitative results chapter draws committee criticism.
How does regression interpretation affect a thesis's overall credibility?
Since regression is one of the most widely used techniques in thesis-level quantitative research, examiners are often specifically trained to check whether assumptions were verified and whether coefficients were interpreted correctly — gaps here are noticed quickly and can undermine confidence in the rest of the analysis.
How long does it take to complete a thesis using this approach?
Thoroughly checking assumptions and interpreting output correctly the first time typically saves time overall, since it avoids the need to re-run and re-interpret models after a committee flags an overlooked violation or an overstated claim.
Is professional help available to interpret regression analysis results for a thesis?
Yes. ThesisLikho's PhD-qualified experts have guided 10,000+ scholars through regression analysis, assumption testing, and complete thesis writing assistance tailored to individual research designs.
Get Expert Guidance on Interpreting Your Regression Results
Interpreting regression output correctly takes more than reading a p-value — it requires verifying assumptions, understanding the difference between statistical and practical significance, and using precise, defensible language throughout. If you'd like expert input on interpreting your regression results or checking your model's assumptions, ThesisLikho's PhD-qualified team offers regression analysis support, statistical interpretation guidance, and complete thesis writing assistance. If you need expert guidance with your data analysis, results chapter, or overall thesis writing, you can explore our Thesis Writing Assistance service.
Talk to a Thesis Expert → https://thesislikho.com/writing-services/thesis-writing