
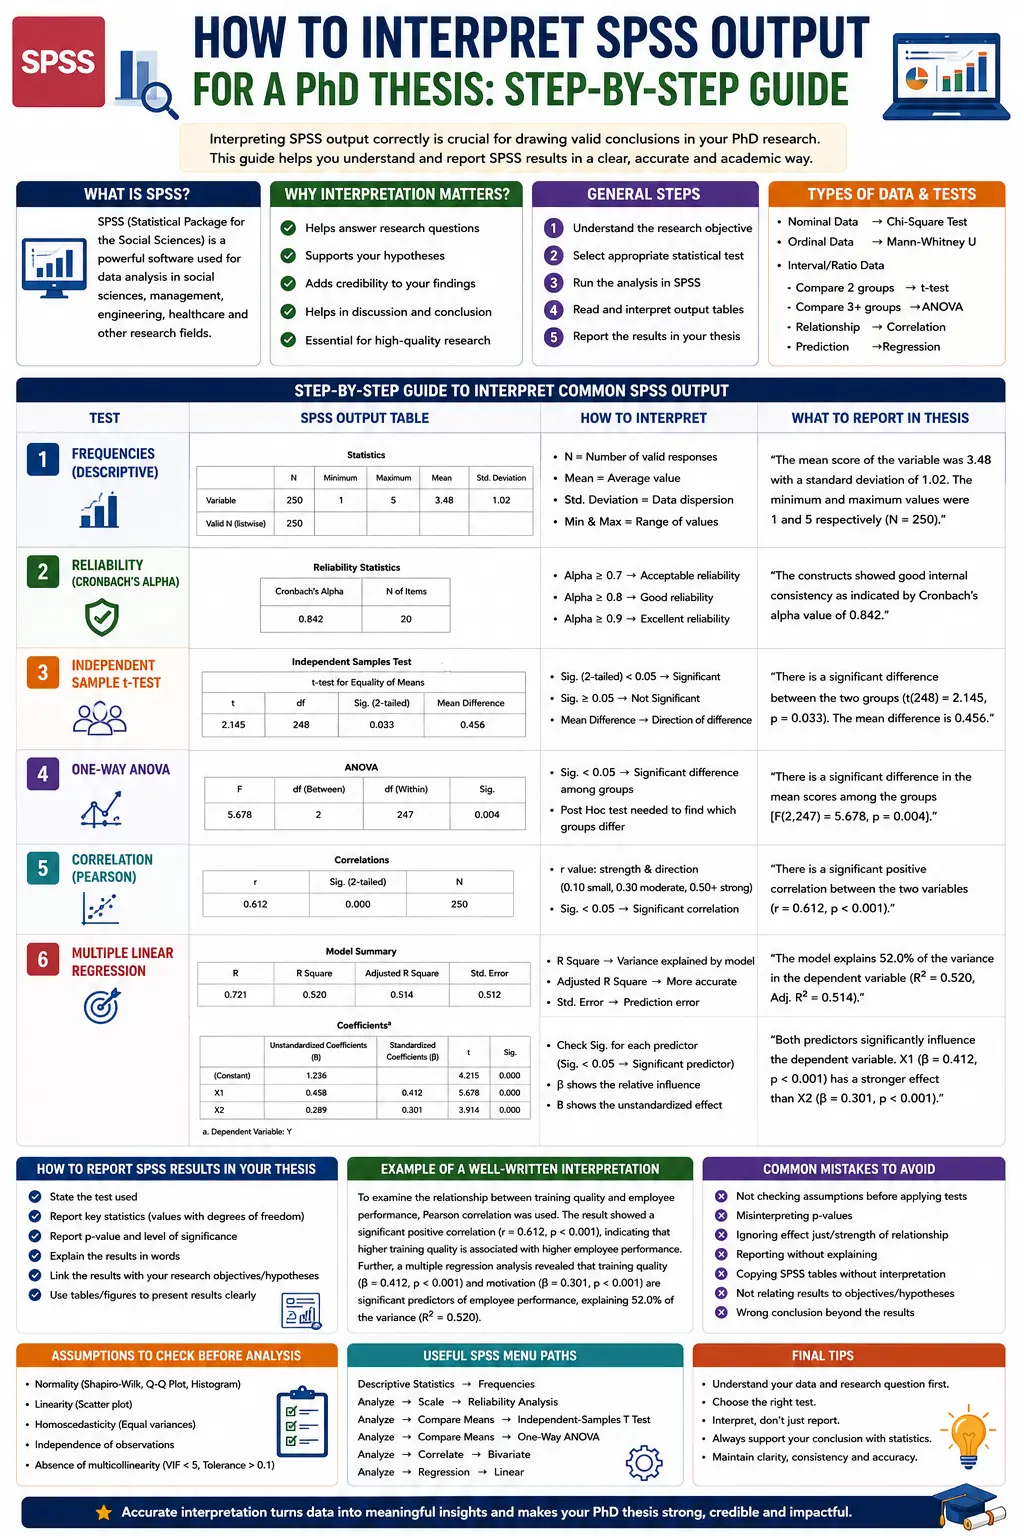
Statistical analysis is a vital part of quantitative research, and IBM SPSS Statistics is one of the most widely used software tools by PhD scholars across India. Whether you're conducting research in management, education, psychology, healthcare, economics, engineering, or the social sciences, SPSS helps transform raw data into meaningful insights through descriptive and inferential statistical analysis.
However, many PhD scholars face a common challenge: interpreting the SPSS output correctly. Running statistical tests is only one part of the research process. The real value lies in understanding what the numbers mean, determining whether hypotheses are supported, and explaining the findings in clear academic language suitable for a PhD thesis.
A common mistake among researchers is copying SPSS tables directly into the thesis without interpretation. Thesis examiners and journal reviewers expect you to explain the statistical results, discuss their significance, and connect them to your research objectives—not simply present software-generated output.
This comprehensive guide explains how to interpret SPSS output step by step. You'll learn how to read descriptive statistics, reliability analysis, correlation, regression, t-tests, ANOVA, chi-square tests, factor analysis, and how to report statistical findings accurately in your PhD thesis.
Why Is SPSS Output Interpretation Important?
Statistical software performs calculations, but researchers are responsible for interpreting the results.
Correct interpretation helps you:
- Answer research questions accurately.
- Test research hypotheses.
- Draw evidence-based conclusions.
- Demonstrate statistical competence.
- Improve the quality of your thesis.
- Increase the likelihood of publication in academic journals.
Without proper interpretation, even well-executed statistical analyses lose much of their value.
Understanding the Structure of SPSS Output
SPSS generates output in the form of tables, charts, and statistical summaries.
A typical output may include:
- Case Processing Summary
- Descriptive Statistics
- Frequency Tables
- Reliability Statistics
- Correlation Matrix
- Regression Results
- ANOVA Table
- t-Test Output
- Chi-Square Tests
- Factor Analysis Results
Each table serves a different purpose and should be interpreted accordingly.
Step 1: Check the Data Before Interpretation
Before interpreting statistical results, ensure your dataset is suitable for analysis.
Verify:
- Missing values
- Duplicate responses
- Outliers
- Coding accuracy
- Sample size
- Assumptions for statistical tests
Data quality issues can significantly affect statistical results and should be addressed before proceeding.
Step 2: Interpret Descriptive Statistics
Descriptive statistics summarize the characteristics of your data.
Common measures include:
- Mean
- Median
- Mode
- Standard deviation
- Minimum
- Maximum
- Frequency
- Percentage
Interpretation
The average score for job satisfaction was 4.15, indicating that respondents generally reported high satisfaction. The relatively small standard deviation (0.61) suggests that participants' responses were fairly consistent.
Do not simply repeat numerical values—explain what they imply.
Step 3: Interpret Frequency Tables
Frequency tables summarize categorical variables.
Interpretation
The sample consisted of 54.8% male and 45.2% female respondents, indicating a relatively balanced gender distribution.
Frequency tables are commonly used for demographic characteristics.
Step 4: Interpret Reliability Analysis
Reliability analysis evaluates whether questionnaire items consistently measure the intended construct.
The most common statistic is Cronbach's Alpha.
measures the strength and direction of the relationship between two variables.
The Pearson correlation coefficient (r) ranges from -1 to +1.
Interpretation
A strong positive relationship was observed between leadership and job satisfaction (r = 0.68). The association was statistically significant, suggesting that higher leadership quality was associated with greater job satisfaction.
Remember that correlation does not establish causation.
Step 6: Interpret Independent Samples t-Test
A t-test compares the means of two groups.
Example
Research Question:
Do trained employees report higher job satisfaction than untrained employees?
Interpretation
Employees who received training reported significantly higher job satisfaction than those who had not received training. Because the p-value was below the conventional significance level, the difference was considered statistically significant.
Report the direction and practical meaning of the difference rather than focusing only on statistical significance.
Step 7: Interpret One-Way ANOVA
ANOVA compares the means of three or more groups.
Example
Research Question:
Does job satisfaction differ across age groups?
SPSS Output
F = 5.84
p = 0.004
Interpretation
The analysis indicated statistically significant differences in job satisfaction across age groups.
If ANOVA is significant, report the results of appropriate post hoc comparisons to identify which groups differ.
Step 8: Interpret Chi-Square Test
The Chi-Square test examines relationships between categorical variables.
Example
Research Question:
Is educational qualification associated with employment sector?
Output
Chi-Square = 12.45
p = 0.01
Interpretation
A statistically significant association was observed between educational qualification and employment sector, indicating that employment sector varied according to educational background.
Avoid interpreting the Chi-Square statistic alone without considering the p-value and practical context.
Step 9: Interpret Regression Analysis
Regression analysis examines how one or more independent variables predict a dependent variable.
SPSS provides several important tables.
Model Summary
The Model Summary includes:
- R
- R²
- Adjusted R²
Example
R² = 0.54
Interpretation
The independent variables explained 54% of the variation in employee performance.
R² indicates explanatory power, not proof of causation.
ANOVA Table
The regression ANOVA table tests whether the overall model is statistically significant.
Example:
F = 45.82
p < 0.001
Interpretation:
The regression model significantly predicted employee performance.
Coefficients Table
Important columns include:
- Standardized coefficients (Beta)
- t-values
- p-values
- Confidence intervals
Interpretation
Leadership had the strongest positive influence on employee performance, followed by motivation. Both predictors were statistically significant.
Interpret the direction, magnitude, and significance of each predictor.
Step 10: Interpret Factor Analysis
Factor analysis identifies underlying dimensions among multiple variables.
Important statistics include:
- KMO Measure
- Bartlett's Test
- Factor Loadings
- Variance Explained
KMO Measure
KMO assesses sampling adequacy.
Higher values generally indicate that factor analysis is appropriate.
Bartlett's Test
Bartlett's Test evaluates whether the correlation matrix is suitable for factor analysis.
A statistically significant result supports proceeding with factor analysis.
Factor Loadings
Factor loadings indicate how strongly each item is associated with a factor.
Higher absolute loadings generally represent stronger relationships.
Variance Explained
This statistic indicates how much of the total variability is captured by the extracted factors.
Interpret these results in relation to your measurement framework.
Understanding Statistical Significance
One of the most misunderstood concepts in SPSS interpretation is the p-value.
A p-value indicates the strength of evidence against the null hypothesis under the assumptions of the statistical test.
Researchers commonly compare the p-value with a pre-specified significance level (often 0.05).
However:
- Statistical significance does not necessarily imply practical importance.
- A non-significant result does not always mean that no relationship exists.
- Results should be interpreted alongside effect sizes, confidence intervals, and the research context.
Avoid overstating conclusions based solely on p-values.
Reporting SPSS Results in a PhD Thesis
Instead of copying SPSS output, summarize the findings clearly.
Poor Example
"Table 4.2 shows the SPSS output."
Better Example
"The regression analysis indicated that leadership was a significant positive predictor of employee performance. The overall model explained 54% of the variance in performance, suggesting substantial explanatory power. These findings support Hypothesis 1."
Always explain what the statistical results mean for your research objectives and hypotheses.
Presenting Tables Effectively
Good tables should:
- Have clear titles.
- Include numbered captions.
- Use consistent formatting.
- Present only relevant statistics.
- Avoid unnecessary decimal places.
Every table should be discussed in the text before or immediately after it appears.
Common SPSS Output Mistakes
Many PhD scholars make avoidable interpretation errors.
Examples include:
- Copying SPSS tables directly into the thesis.
- Reporting p-values without interpretation.
- Confusing correlation with causation.
- Ignoring assumptions of statistical tests.
- Overlooking effect sizes.
- Reporting only statistically significant findings while ignoring non-significant results.
- Using inconsistent decimal places.
- Misinterpreting standardized and unstandardized coefficients.
Careful review helps prevent these mistakes.
Best Practices for Interpreting SPSS Output
To improve the quality of your thesis:
- Understand the purpose of each statistical test before interpreting it.
- Check data quality before analysis.
- Verify that assumptions for the chosen tests are reasonably satisfied.
- Explain results in plain academic language.
- Relate findings to your research objectives and hypotheses.
- Report both statistical and practical significance where appropriate.
- Present concise, well-formatted tables.
- Compare your findings with previous research in the discussion chapter rather than the results chapter (unless your institutional guidelines combine them).
Frequently Asked Questions (FAQs)
Can I copy SPSS output directly into my thesis?
It is generally better to summarize and format results into clear, reader-friendly tables. Raw SPSS output may be included in the appendix if required by your university.
What is the most important value in SPSS output?
There is no single most important value. The relevant statistics depend on the analysis being performed. Researchers should interpret results holistically rather than focusing on one number.
How should I report p-values?
Report exact p-values when appropriate or indicate when they are below conventional thresholds (for example, p < 0.001). Always interpret them in the context of your hypotheses and research questions.
What should I do if my results are not statistically significant?
Non-significant findings are still valuable. Report them honestly, discuss possible explanations, and relate them to the existing literature. Avoid altering analyses solely to obtain significant results.
Should I explain every table?
Yes. Every table or figure included in your thesis should be accompanied by a concise interpretation that highlights the key findings and explains their relevance to your study.
Conclusion
Interpreting SPSS output is one of the most important skills for quantitative PhD research. While SPSS performs the statistical calculations, the responsibility for understanding, explaining, and communicating the results rests with the researcher. A strong thesis goes beyond presenting software-generated tables—it interprets the findings, connects them to research objectives and hypotheses, and demonstrates how the evidence supports the study's conclusions.
Whether you are analyzing descriptive statistics, reliability, correlations, regression models, ANOVA, t-tests, chi-square tests, or factor analysis, the key is to explain what the results mean in clear academic language. By carefully checking your data, selecting appropriate statistical tests, reporting results transparently, and interpreting them thoughtfully, you can produce a high-quality data analysis chapter that meets university standards and strengthens the overall impact of your PhD thesis.
Website: www.thesislikho.com
Call / WhatsApp: +91-96438 02216