
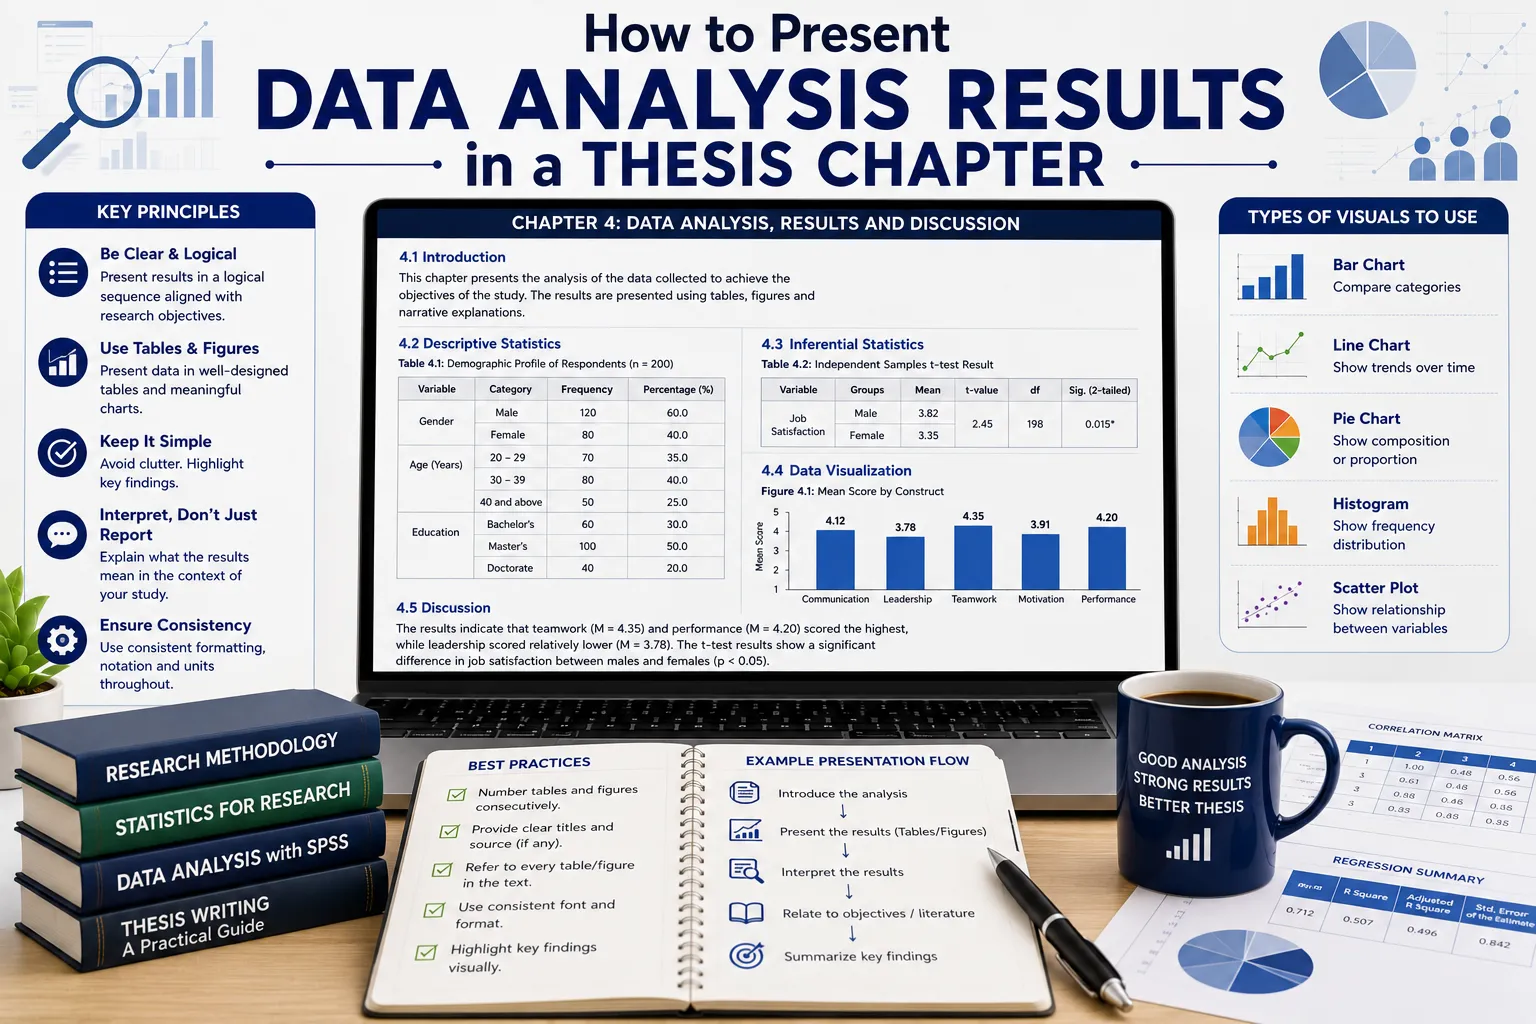
You've run every test, cleaned every dataset, and coded every theme — but the results chapter is where all of that work either lands clearly or gets muddled. This is also the chapter where a specific, well-known trap catches thesis writers at every level: slipping from reporting findings into interpreting them before the reader is ready. This guide walks through how to present data analysis results in a thesis chapter clearly, objectively, and in a way that examiners can follow without effort.
The single rule that trips up thesis writers more than any other: report findings, do not discuss them. A strong results chapter presents findings in a logical order tied to your research questions or hypotheses, using text, tables, and figures to report data objectively — with no interpretation, argumentation, or reference to the literature. That comes later, in your discussion chapter.
Why This Separation Matters More Than It Seems
Mixing results (what you found) with discussion (what it means) is one of the most common errors in thesis writing, and it can genuinely cost you marks. Current academic guidance emphasizes strict separation: results describe, discussion interprets. Past tense should be used consistently throughout the results chapter when describing findings, with present tense reserved only for established facts, and the chapter should end with a brief, non-interpretive summary of the major patterns — not a preview of what those patterns mean.
If you find yourself writing "this suggests" or "this indicates that" anywhere in your results chapter, pause — that's discussion language, and it belongs in the next chapter.
Choose the Right Organizational Structure for Your Data
There are two dominant organizational structures, and the right choice depends on your research design, not personal preference:
For quantitative research, organize by research question or hypothesis. Each subsection should address one specific research question or test one specific hypothesis, following the same sequence you used in your introduction and methodology chapters. This lets your reader follow the logical thread from question to finding with no effort — they already know what to expect in each section because you told them earlier in the thesis.
For qualitative research, organize by theme or pattern, not by participant or by individual interview question. Examiners want to see findings in relation to what you set out to investigate, not a raw walkthrough of your data collection process or a participant-by-participant recap.
Presenting Quantitative Results
Follow the Standard Reporting Sequence
Quantitative results should generally be reported in a specific order: demographic data first, then reliability tests (such as Cronbach's Alpha for scaled instruments), then descriptive statistics, and finally inferential statistics. This sequence gives your reader a coherent build-up — from basic sample description toward the substantive hypothesis testing that answers your actual research questions — rather than jumping straight to complex statistical output without context.
Structure Each Research Question Section Consistently
Within each research question or hypothesis section, present findings moving from the most fundamental to the most complex — or from descriptive to inferential. In a survey-based study, for example, you might begin with descriptive statistics for your key variables before moving to correlation or regression results addressing the same question.
Report Effect Sizes, Not Just P-Values
A commonly flagged gap in quantitative results chapters is missing effect sizes — p-values alone don't convey practical significance. Alongside your test statistic, degrees of freedom, and p-value, report an appropriate effect size (Cohen's d, eta-squared, or a correlation coefficient, depending on your test) so your reader understands not just whether an effect was statistically significant, but how large or meaningful it actually was.
Presenting Qualitative Results
Organize by Theme, With a Consistent Structure
Each theme should be presented with a consistent internal structure: a descriptive heading, a brief explanation of what the theme represents, and supporting quotes from participants. This consistency helps your reader move through multiple themes without having to re-orient each time.
Handle Participant Quotes and Identifiers Properly
When presenting qualitative quotes, always use anonymised participant labels — P1, P2, or Participant A, Participant B — rather than real names. Include relevant demographic information in brackets where it adds useful context, for example: "(P7, female, senior manager, 12 years' experience)." This protects participant confidentiality while still helping your reader understand who is speaking and why their perspective matters to the theme being discussed.
Universal Principles That Apply to Both Approaches
Maintain the Golden Thread
Align every single finding you report directly with a stated research question or hypothesis. This "golden thread" running through your chapter is what keeps a reader oriented — if a piece of data doesn't clearly connect back to something you set out to investigate, it likely belongs in an appendix, not the main chapter.
Use Tables and Figures to Supplement, Not Replace, Your Prose
Tables, figures, and charts should support your written text, making complex data easier to grasp quickly — they shouldn't stand in for the prose explanation of what the data shows. Every table and figure needs a clear title, correct numbering, and enough labeling that it could be understood on its own if separated from the surrounding text.
Report Everything Honestly, Including Inconvenient Findings
Report unusual findings, outliers, or null results transparently rather than omitting them. Selectively excluding results that don't fit your expectations is a serious methodological and ethical problem, not a stylistic choice — a null result reported honestly and clearly is far more defensible than a chapter that quietly avoids mentioning it.
Confirm No Orphaned Methods or Results
Every result you present should correspond to a method described earlier in your methodology chapter, and every method described earlier should produce a result presented here. Orphaned methods (described but never reported on) or orphaned results (appearing with no corresponding described method) are a red flag examiners specifically look for.
Practical Length Benchmarks
The results chapter typically comprises 15–20% of the total thesis word count. For an 80,000-word PhD thesis, this translates to roughly 12,000–16,000 words; for a 15,000-word Master's dissertation, roughly 2,000–3,000 words. Qualitative thematic findings chapters can run proportionally longer — 20–25% of total word count — given the space needed for direct quotes and theme development. Students consistently over-write this chapter by 40–60%, diluting its impact; the antidote is selective reporting — report only what directly answers your research questions, and move supplementary or tangential data to appendices.
Step-by-Step: Drafting Your Results Chapter
- Return to your research aims, objectives, and research questions — these are the governing framework for the entire chapter
- For each research question, list the specific data, tests, or analyses that address it
- Choose your organizational structure (by research question/hypothesis for quantitative; by theme for qualitative) and apply it consistently
- Write the chapter while your analysis is still fresh, rather than waiting until every other chapter is drafted
- Create a simple outline organized by research question or theme, and fill it with the specific results you need to report before writing full prose
- Use placeholder text for complex tables initially, refining them once your prose structure is in place
- Draft without concern for length first — report all relevant findings completely — then identify where brevity or reorganization is possible during revision
- Check tense consistency (past tense for your findings) and confirm no interpretive language has slipped in
- End with a brief, non-interpretive summary of the major patterns that leads naturally into your discussion chapter
Practical Checklist: Is Your Results Chapter Ready?
- No interpretation, argumentation, or literature references appear anywhere in the chapter
- Organizational structure (by research question/hypothesis, or by theme) matches your research design
- Quantitative results follow the sequence: demographics, reliability tests, descriptive statistics, inferential statistics
- Qualitative themes each follow a consistent structure with heading, explanation, and supporting quotes
- Participant quotes use anonymised identifiers, with demographic context in brackets where relevant
- Every finding connects clearly back to a stated research question or hypothesis
- Tables and figures are correctly labeled, numbered, and supplement (not replace) the prose
- Effect sizes are reported alongside p-values for quantitative findings
- Unusual findings, outliers, and null results are reported transparently
- No orphaned methods (described but unreported) or orphaned results (reported but undescribed)
- Chapter length falls within the 15–20% (quantitative) or 20–25% (qualitative) benchmark for your thesis
- Chapter ends with a brief, non-interpretive summary, not a preview of the discussion
Two Practical Scenarios
Scenario 1 — Catching Interpretation Language During Revision
A scholar drafting their quantitative results chapter wrote, "The regression results suggest that job satisfaction is strongly influenced by managerial support, indicating that organizations should prioritize supervisor training." On revision, they recognized the second half of this sentence was discussion, not results, and revised it to simply state the regression coefficient, its significance, and effect size — moving the interpretive claim about organizational implications to the discussion chapter where it belonged.
Scenario 2 — Restructuring a Qualitative Chapter Organized by Participant
A scholar initially drafted their qualitative findings chapter walking through each of their 15 interview participants one by one, summarizing what each person said. A committee member noted this made it difficult to see the actual patterns across the dataset. The scholar restructured the chapter around four core themes that had emerged from coding, with each theme drawing selectively on quotes from multiple participants — producing a chapter that directly answered the research questions rather than simply recapping the interviews in sequence.
Common Mistakes Thesis Writers Make Presenting Results
- Slipping into interpretation ("this suggests," "this indicates") before the discussion chapter.
- Organizing qualitative findings by participant or interview question instead of by theme.
- Reporting p-values without effect sizes, leaving practical significance unclear.
- Omitting null results or outliers that don't fit the expected narrative.
- Over-writing the chapter significantly beyond the 15–20% length benchmark, diluting the impact of the genuinely important findings.
Frequently Asked Questions
How do you present data analysis results in a thesis chapter?
Organize your findings by research question or hypothesis (for quantitative work) or by theme (for qualitative work), report objectively in past tense with no interpretation, use tables and figures to supplement rather than replace your prose, and end with a brief, non-interpretive summary of the major patterns.
Why does how you present data analysis results matter for a thesis? Mixing results with discussion, omitting effect sizes, or organizing findings in a way that obscures your research questions are all common reasons a results chapter draws committee criticism, regardless of how strong the underlying analysis actually is.
How does results presentation affect a thesis's overall clarity?
A results chapter that maintains a clear golden thread back to the research questions, uses consistent organization, and separates description from interpretation makes it significantly easier for examiners to follow your argument and trust your findings.
How long does it take to complete a thesis using this approach?
Drafting the results chapter while your analysis is still fresh, using an outline-first approach, typically speeds up the writing process compared to attempting it long after the analysis was completed.
Is professional help available to present data analysis results in a thesis chapter?
Yes. ThesisLikho's PhD-qualified experts have guided 10,000+ scholars through results chapter structuring, statistical and thematic presentation, and complete thesis writing assistance tailored to individual research designs.
Get Expert Guidance on Your Results Chapter
Presenting your findings clearly, objectively, and in the right structure takes careful planning — and a firm boundary against slipping into interpretation before your discussion chapter. If you'd like expert input on structuring your results chapter or presenting your statistical or thematic findings effectively, ThesisLikho's PhD-qualified team offers results chapter structuring support, presentation guidance, and complete thesis writing assistance. If you need expert guidance with your data presentation, chapter structure, or overall thesis writing, you can explore our Thesis Writing Assistance service.
Talk to a Thesis Expert → https://thesislikho.com/writing-services/thesis-writing