
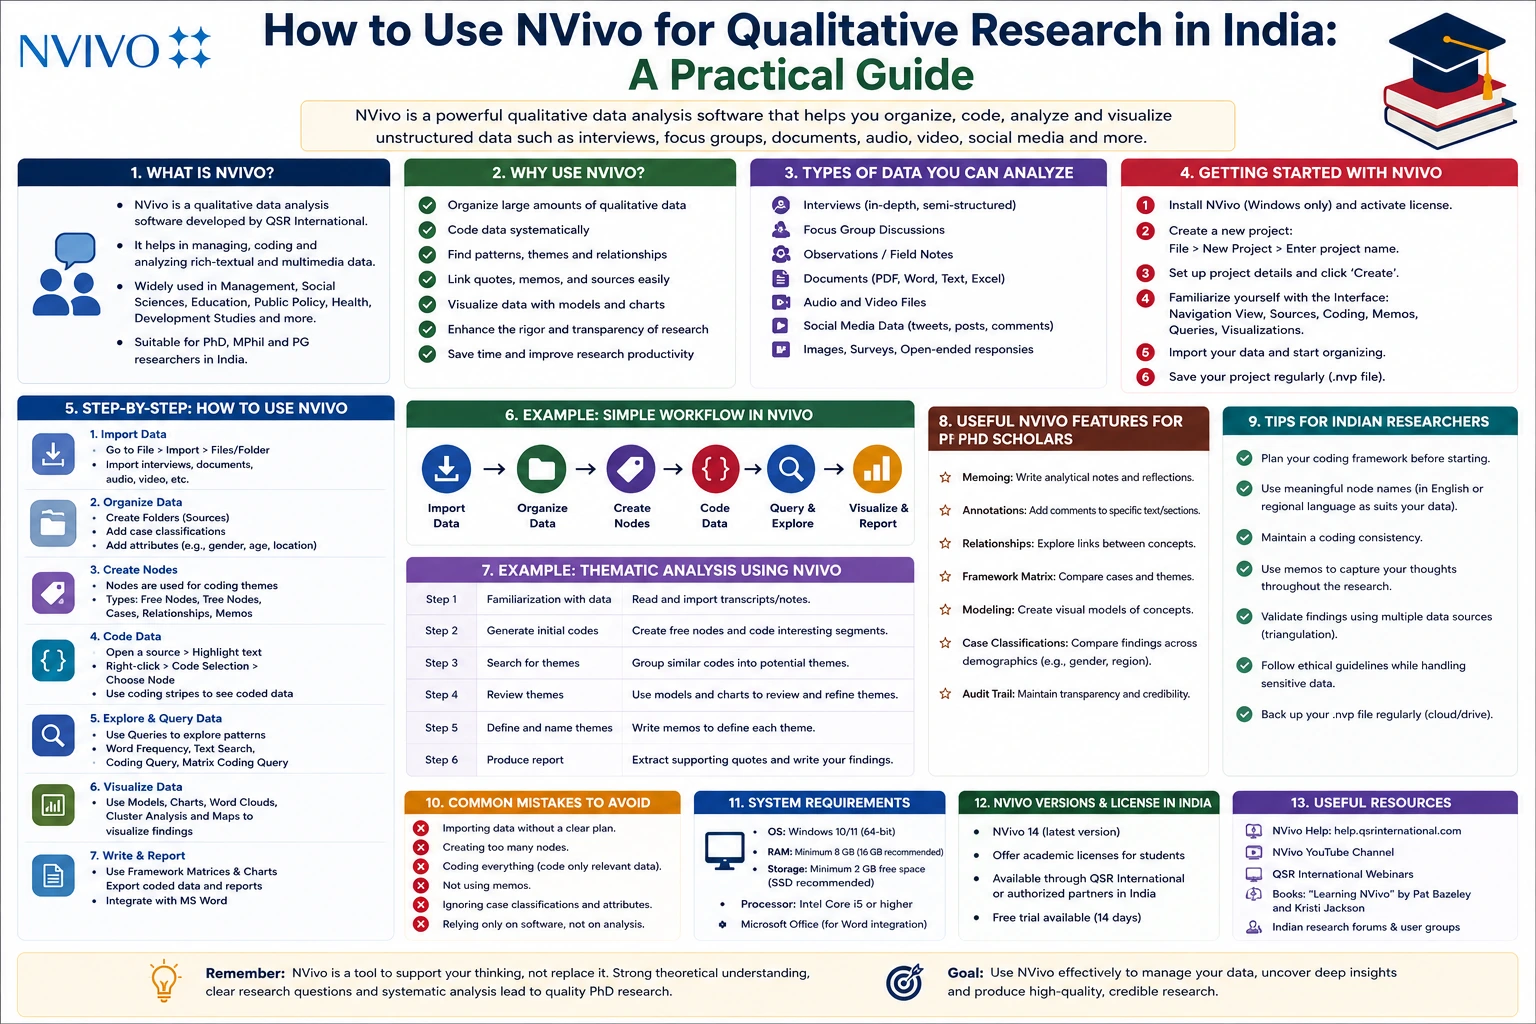
Qualitative research plays a crucial role in understanding human experiences, opinions, behaviors, and social phenomena. Unlike quantitative research, which focuses on numerical data and statistical analysis, qualitative research explores the meaning behind people's thoughts, perceptions, and lived experiences. As a result, researchers often deal with large volumes of textual, audio, video, and visual data that require systematic organization and analysis.
For PhD scholars in India, manually analyzing hundreds of interview transcripts, focus group discussions, observation notes, policy documents, and open-ended survey responses can be time-consuming and prone to inconsistencies. This is where NVivo becomes an invaluable research tool. NVivo is one of the world's leading qualitative data analysis software (QDAS) platforms, helping researchers organize, code, analyze, and visualize qualitative data efficiently.
Universities, research institutions, and academic journals increasingly recognize NVivo as a trusted tool for qualitative and mixed-methods research. Whether you're pursuing a PhD in education, management, psychology, healthcare, sociology, public policy, law, media studies, or social sciences, learning NVivo can significantly improve the quality, transparency, and credibility of your research.
In this comprehensive guide, you'll learn what NVivo is, why researchers use it, its key features, how to conduct qualitative data analysis using NVivo, best practices, common mistakes to avoid, and practical tips for Indian PhD scholars.
What Is NVivo?
NVivo is qualitative data analysis software developed to help researchers manage and analyze unstructured or semi-structured data. Instead of performing statistical calculations, NVivo assists researchers in identifying patterns, organizing themes, coding data, and interpreting qualitative findings.
The software supports various data types, including:
- Interview transcripts
- Focus group discussions
- Observation notes
- Open-ended survey responses
- PDF documents
- Word files
- Audio recordings
- Video files
- Images
- Social media data (where supported and ethically collected)
Rather than replacing the researcher's interpretation, NVivo helps organize and streamline the analytical process.
Why Is NVivo Popular Among PhD Scholars?
Qualitative research often involves hundreds or even thousands of pages of textual data. Managing this information manually can become overwhelming.
NVivo simplifies qualitative analysis by helping researchers:
- Organize large datasets.
- Code data consistently.
- Identify recurring themes.
- Compare participant responses.
- Visualize relationships.
- Maintain transparent documentation.
- Improve research rigor and reproducibility.
These capabilities make NVivo particularly valuable for doctoral research involving extensive qualitative datasets.
Research Fields That Commonly Use NVivo
NVivo is widely used across numerous disciplines.
These include:
- Education
- Management and Business Studies
- Sociology
- Psychology
- Healthcare and Nursing
- Public Health
- Social Work
- Political Science
- Anthropology
- Law
- Media and Communication
- Public Administration
- Human Resource Management
- Marketing
- Tourism and Hospitality
It is also frequently used in mixed-methods research to analyze qualitative components alongside quantitative findings.
Types of Data You Can Analyze in NVivo
One of NVivo's greatest strengths is its ability to work with multiple data formats.
Common examples include:
Interview Transcripts
Semi-structured and unstructured interviews are among the most common qualitative data sources for PhD research.
Focus Group Discussions
Researchers can compare viewpoints across multiple participants within a single discussion or across different groups.
Observation Notes
Field observations from ethnographic or case study research can be coded and analyzed systematically.
Open-Ended Survey Responses
NVivo can organize and analyze narrative responses from questionnaires.
Policy Documents
Government reports, organizational policies, legal documents, and institutional guidelines can all be examined using thematic coding.
Audio and Video Files
Researchers can code directly from recordings without fully transcribing every segment, although accurate transcripts are often recommended for detailed analysis.
Key Features of NVivo
NVivo offers numerous tools that simplify qualitative analysis.
1. Data Organization
Researchers can import and organize files into structured folders, making it easier to manage large research projects.
Keeping all materials in one project improves efficiency and reduces the risk of losing important data.
2. Coding
Coding is the core activity in qualitative research.
In NVivo, researchers assign labels (called codes or nodes) to meaningful sections of text, images, or media.
For example:
Interview excerpt:
"My supervisor always encouraged me during difficult stages of my research."
Possible code:
Supervisor Support
As coding progresses, patterns begin to emerge across participants.
3. Nodes
Nodes are containers that store coded information.
Researchers can create:
- Parent nodes
- Child nodes
- Hierarchical coding structures
Example:
Research Experience
- Academic Challenges
- Supervisor Support
- Financial Difficulties
- Mental Well-being
This hierarchical organization makes it easier to explore relationships among themes.
4. Memo Writing
NVivo allows researchers to write memos throughout the analytical process.
Memos can capture:
- Initial impressions
- Emerging themes
- Methodological decisions
- Analytical reflections
- Theoretical ideas
Maintaining detailed memos strengthens the transparency and credibility of qualitative research.
5. Queries
Queries help researchers explore coded data more deeply.
Common query types include:
- Text Search Query
- Word Frequency Query
- Coding Query
- Matrix Coding Query
These tools help identify recurring concepts, compare participant groups, and examine relationships between themes.
6. Data Visualization
NVivo includes several visualization tools that make findings easier to understand and communicate.
Examples include:
- Word Clouds
- Tree Maps
- Hierarchy Charts
- Cluster Analysis Diagrams
- Mind Maps
- Concept Maps
- Comparison Charts
These visuals can enrich thesis chapters and conference presentations, provided they are accompanied by clear interpretation.
How to Use NVivo for Qualitative Research
The following workflow provides a practical approach to conducting qualitative analysis.
Step 1: Create a New Project
Begin by creating a new NVivo project.
Choose a clear project name related to your research topic and organize folders for:
- Interviews
- Focus groups
- Documents
- Memos
- Images
- Audio or video files
A well-structured project saves time as the analysis progresses.
Step 2: Import Your Data
NVivo supports importing multiple file types, including:
- Microsoft Word documents
- PDFs
- Excel files
- Audio recordings
- Video recordings
- Images
- Text files
Ensure files are clearly named and organized before importing.
Step 3: Read the Data Carefully
Before coding, read each transcript thoroughly.
During this stage:
- Highlight important ideas.
- Note recurring concepts.
- Record initial observations in memos.
- Avoid rushing into coding.
Immersion in the data is essential for high-quality qualitative analysis.
Step 4: Begin Coding
Select meaningful sections of text and assign them to relevant nodes.
Example:
Participant statement:
"Time management became my biggest challenge during the research."
Possible code:
Time Management Challenges
As more transcripts are coded, additional examples accumulate under the same node, making patterns easier to identify.
Step 5: Develop Themes
After coding multiple transcripts, group related codes into broader themes.
Example:
Theme:
Challenges Faced by PhD Scholars
Subthemes:
- Time Management
- Financial Constraints
- Supervisor Communication
- Family Responsibilities
- Research Anxiety
Themes should align with your research questions and objectives.
Step 6: Use Queries to Explore Patterns
Run queries to examine:
- Frequently used words
- Relationships between themes
- Differences across participant groups
- Co-occurrence of concepts
For example, a Matrix Coding Query can compare themes across demographic groups, such as early-career versus experienced researchers.
Step 7: Create Visualizations
Generate visual outputs that summarize your findings.
Examples include:
Word Cloud
Displays frequently occurring terms.
Tree Map
Illustrates the relative prominence of themes.
Cluster Analysis
Groups similar participants or themes based on coding patterns.
Remember that visualizations should support—not replace—your written analysis.
Step 8: Interpret the Findings
NVivo helps organize and retrieve data, but interpretation remains the researcher's responsibility.
Ask questions such as:
- What patterns emerge?
- How do themes relate to the research questions?
- Are there similarities or differences among participants?
- How do the findings connect with existing literature?
Interpretation should move beyond description to explain the significance of the results.
Using NVivo for Different Research Methodologies
NVivo supports a variety of qualitative approaches.
Thematic Analysis
Identify, organize, and interpret recurring themes across datasets.
Grounded Theory
Develop theories inductively through systematic coding and constant comparison.
Phenomenology
Explore participants' lived experiences in depth.
Case Study Research
Analyze multiple data sources related to one or more cases.
Content Analysis
Systematically categorize textual or visual content.
Choose an analytical approach that aligns with your research design.
Advantages of Using NVivo
NVivo offers numerous benefits for doctoral researchers.
Saves Time
Coding, retrieving, and organizing data become significantly more efficient than manual methods.
Improves Organization
All project materials are stored in one searchable environment.
Enhances Transparency
Coding decisions, memos, and analytical processes are documented systematically, supporting research credibility.
Supports Large Datasets
NVivo is particularly useful for studies involving dozens or hundreds of interviews or extensive document collections.
Facilitates Collaboration
Research teams can work more consistently when coding frameworks and project structures are clearly defined.
Limitations of NVivo
Despite its advantages, researchers should recognize its limitations.
Learning Curve
Beginners may need time to become familiar with the software and its terminology.
Commercial Licensing
NVivo requires a paid license, although many universities provide institutional access.
Interpretation Cannot Be Automated
NVivo organizes and retrieves data but does not replace critical thinking or qualitative interpretation.
Risk of Over-Coding
Creating too many overlapping codes can make analysis unnecessarily complex.
Thoughtful planning and regular review of the coding framework help avoid this issue.
Best Practices for Using NVivo
To maximize the effectiveness of NVivo:
- Develop a clear coding strategy before beginning analysis.
- Read transcripts carefully before assigning codes.
- Keep code names concise and meaningful.
- Use memos to document analytical decisions.
- Review and refine codes regularly.
- Avoid creating unnecessary duplicate nodes.
- Back up your project frequently.
- Align themes with your research objectives and theoretical framework.
Following these practices improves consistency and analytical rigor.
Common Mistakes to Avoid
Many first-time users make avoidable errors.
Common mistakes include:
- Treating NVivo as a substitute for qualitative analysis.
- Creating too many codes without clear definitions.
- Ignoring memo writing.
- Failing to review coding consistency.
- Over-relying on word frequency counts.
- Producing visualizations without interpretation.
- Neglecting regular project backups.
Remember that software supports the analytical process—it does not perform the intellectual work of interpreting data.
Frequently Asked Questions (FAQs)
Is NVivo free?
No. NVivo is commercial software, although many universities and research institutions provide licensed access for students and faculty.
Can NVivo analyze quantitative data?
NVivo is primarily designed for qualitative and mixed-methods research. While it can organize certain structured data and support integration with quantitative findings, it is not intended to replace statistical software such as SPSS, R, STATA, or Python.
Do I need coding experience to use NVivo?
No programming skills are required. However, understanding qualitative research methods and coding principles is essential for meaningful analysis.
Is NVivo suitable for mixed-methods research?
Yes. NVivo is widely used to analyze qualitative data within mixed-methods studies and can complement quantitative analyses conducted in other software.
Can NVivo automatically identify themes?
NVivo provides tools such as word frequency and text search queries that help explore patterns, but identifying and interpreting themes remains the responsibility of the researcher.
Conclusion
NVivo has become one of the most widely used qualitative data analysis tools for PhD research because it helps researchers organize, code, analyze, and visualize complex datasets in a systematic and transparent manner. Whether you are working with interview transcripts, focus group discussions, observation notes, policy documents, or open-ended survey responses, NVivo streamlines the analytical process while maintaining a clear audit trail of coding and interpretation.
However, it is important to remember that NVivo is a research support tool—not an automated analysis engine. High-quality qualitative research still depends on thoughtful coding, careful interpretation, methodological rigor, and a strong connection between your findings and research objectives. By combining NVivo's powerful organizational features with sound qualitative research practices, PhD scholars can produce credible, well-structured, and publication-ready research that makes a meaningful contribution to their academic discipline.
Website: www.thesislikho.com
Call / WhatsApp: +91-96438 02216