
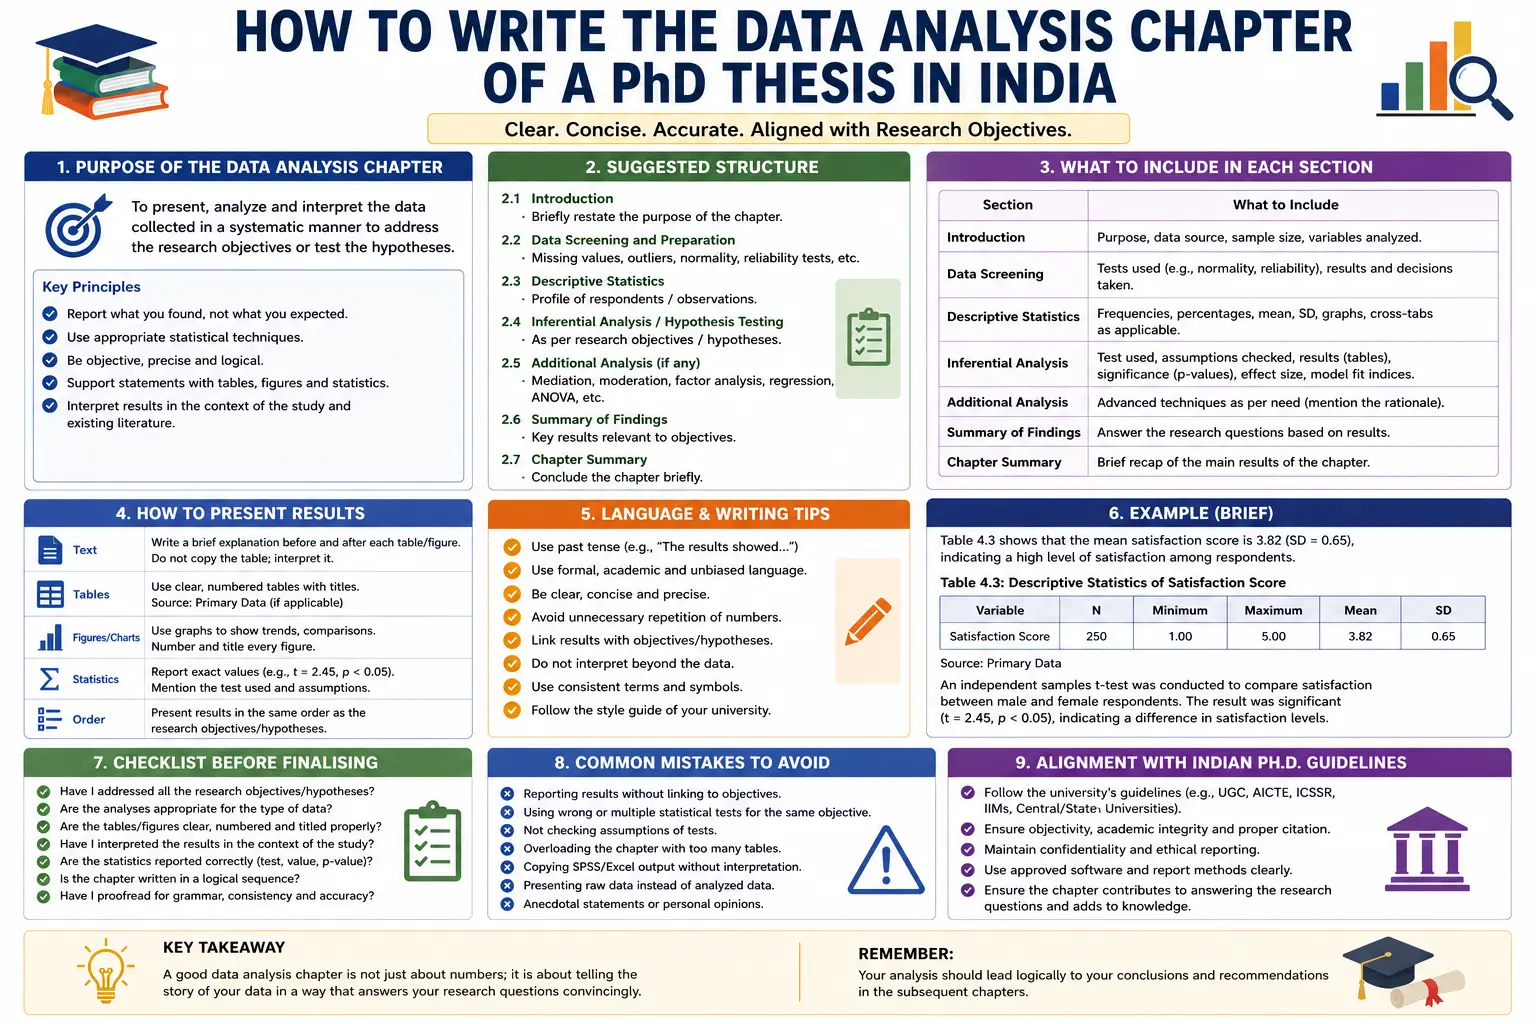
The data analysis chapter is one of the most critical sections of a PhD thesis. It is where you transform raw data into meaningful insights, answer your research questions, and demonstrate that your conclusions are supported by evidence. Regardless of your discipline—management, education, engineering, healthcare, social sciences, economics, or science—the quality of your data analysis chapter significantly influences how your thesis is evaluated by supervisors, examiners, and journal reviewers.
Many PhD scholars in India find this chapter challenging because it requires more than simply presenting tables and statistical outputs. A strong data analysis chapter explains what was analyzed, why specific methods were chosen, what the results mean, and how those findings relate to the research objectives and hypotheses. It should present data logically, interpret the results accurately, and maintain a clear connection with the overall research framework.
This comprehensive guide explains how to write the data analysis chapter of a PhD thesis in India, including its structure, essential components, writing style, interpretation techniques, common mistakes, and best practices.
What Is the Data Analysis Chapter?
The data analysis chapter presents the results obtained after collecting and processing research data. It explains how the collected information was analyzed using qualitative, quantitative, or mixed-method approaches and demonstrates how the findings answer the research questions.
Unlike the methodology chapter, which focuses on how data were collected and which analytical methods were selected, the data analysis chapter concentrates on what the analysis revealed.
Typically, this chapter includes:
- Data preparation
- Descriptive statistics
- Inferential statistics (if applicable)
- Qualitative themes (for qualitative research)
- Tables and figures
- Interpretation of results
- Links to research objectives and hypotheses
The emphasis should always be on explaining the meaning of the findings rather than merely presenting statistical software output.
Why Is the Data Analysis Chapter Important?
The data analysis chapter is often considered the evidence base of your thesis. It demonstrates whether your research objectives have been achieved and whether your hypotheses are supported.
A well-written chapter helps to:
- Answer the research questions clearly.
- Present findings objectively.
- Demonstrate analytical competence.
- Build confidence in your conclusions.
- Support later discussions and recommendations.
- Increase the likelihood of publishing research papers based on your thesis.
Without a clear and well-structured analysis chapter, even a well-designed research study may appear incomplete.
Where Does the Data Analysis Chapter Fit in a PhD Thesis?
Although universities may use different formats, a typical PhD thesis structure is:
- Introduction
- Literature Review
- Research Methodology
- Data Analysis and Results
- Discussion
- Conclusion and Recommendations
- References
- Appendices
The data analysis chapter bridges the gap between the methodology and discussion chapters. It presents the evidence that will later be interpreted in relation to existing literature.
Preparing Before Writing the Chapter
Before drafting the chapter, ensure that your data are complete, organized, and ready for analysis.
Key preparation steps include:
- Clean the dataset by correcting coding errors and removing duplicate records.
- Handle missing data appropriately.
- Check for outliers where relevant.
- Verify that assumptions for statistical tests are satisfied.
- Organize qualitative transcripts or coded responses.
- Ensure that tables and figures are accurate and clearly labeled.
Proper preparation saves time and reduces the likelihood of inconsistencies later.
Structure of the Data Analysis Chapter
Although structures vary across disciplines, the following format is widely accepted in Indian universities.
1. Introduction to the Chapter
Begin with a brief overview explaining the purpose of the chapter.
Include:
- The objectives of the analysis.
- The type of data analyzed.
- The statistical or qualitative software used.
- A brief outline of what readers can expect.
Example
This chapter presents the analysis of data collected from 320 respondents to examine the factors influencing employee engagement in Indian manufacturing companies. Data were analyzed using SPSS Version 29. Descriptive statistics, reliability analysis, correlation analysis, and multiple regression were conducted to address the research objectives and test the proposed hypotheses.
Keep this introduction concise while setting the context for the analyses that follow.
2. Data Preparation
Before presenting results, explain how the data were prepared.
Topics may include:
- Number of responses received.
- Number of valid responses retained.
- Missing data treatment.
- Outlier detection.
- Data coding procedures.
- Reliability of data entry.
Example
- Total questionnaires distributed: 400
- Responses received: 348
- Valid responses analyzed: 332
- Missing values: 2.8%, addressed using multiple imputation
Providing this information demonstrates transparency in the research process.
3. Demographic Profile of Respondents
If your study involves survey participants, summarize their demographic characteristics.
Common variables include:
- Age
- Gender
- Education
- Occupation
- Work experience
- Income
- Geographic location
Present these using frequency tables and percentages.
4. Descriptive Statistics
Descriptive statistics summarize the main characteristics of the data.
Depending on your research, report:
- Mean
- Median
- Standard deviation
- Minimum and maximum values
- Frequencies
- Percentages
5. Validity Testing
Many quantitative studies also include validity assessments.
Common methods include:
- Content validity
- Construct validity
- Convergent validity
- Discriminant validity
- Exploratory Factor Analysis (EFA)
- Confirmatory Factor Analysis (CFA)
If factor analysis is performed, report:
- KMO value
- Bartlett's Test of Sphericity
- Factor loadings
- Variance explained
Clearly explain why the validity assessment supports the use of the measurement instrument.
6. Inferential Statistical Analysis
This section addresses the core research questions and hypotheses.
The techniques used depend on your research design.
Common analyses include:
Correlation Analysis
Used to examine relationships between variables.
Example:
A moderate positive correlation was observed between leadership quality and employee engagement, suggesting that better leadership tends to be associated with higher engagement levels.
Regression Analysis
Regression determines the influence of predictor variables on an outcome.
Report:
- Regression coefficients
- Standard errors
- P-values
- Confidence intervals
- R² and Adjusted R²
- F-statistic
Interpret findings in plain language.
t-Test
Used to compare the means of two groups.
Example:
An independent samples t-test showed that employees who received regular training reported significantly higher job satisfaction than those who did not.
ANOVA
Applied when comparing three or more groups.
Example:
One-way ANOVA indicated statistically significant differences in customer satisfaction across service categories.
If ANOVA is significant, mention any post hoc tests performed.
Chi-Square Test
Appropriate for categorical variables.
Example:
A significant association was found between educational qualification and employment sector.
Always explain the practical meaning of the results.
7. Qualitative Data Analysis (If Applicable)
For qualitative or mixed-methods studies, organize findings into themes.
Include:
- Major themes
- Supporting participant quotations
- Interpretation of patterns
- Relationships between themes
Example
Theme 1: Supervisor Support
Participants consistently described supervisor encouragement as a key factor influencing research motivation.
"Regular guidance from my supervisor helped me remain focused during difficult stages of the research."
Use quotations selectively to support interpretations rather than allowing them to dominate the chapter.
8. Presenting Tables and Figures
Tables and figures improve clarity when used appropriately.
Examples include:
- Frequency tables
- Correlation matrices
- Regression summaries
- Histograms
- Bar charts
- Line graphs
- Scatter plots
- Box plots
Best practices:
- Number every table and figure.
- Provide clear titles.
- Mention each table or figure in the text before it appears.
- Avoid unnecessary duplication of information.
Use visuals to complement, not replace, written interpretation.
9. Interpretation of Results
One of the most common mistakes is stopping after presenting statistical output.
Every important result should answer questions such as:
- What does this finding mean?
- Is the relationship statistically significant?
- Is it practically meaningful?
- Does it support the research hypothesis?
- How does it contribute to the research objectives?
Interpretations should remain objective. Save broader comparisons with previous studies for the discussion chapter unless your university's guidelines combine results and discussion.
Writing Style for the Data Analysis Chapter
Maintain a clear, formal, and objective writing style.
Good practices include:
- Use the past tense when describing completed analyses.
- Explain statistical results in plain language.
- Avoid excessive technical jargon where simpler wording is sufficient.
- Report numerical results consistently.
- Use subheadings to improve readability.
Remember that the goal is to help readers understand the findings—not simply display statistical outputs.
Common Mistakes to Avoid
Many PhD scholars weaken their analysis chapter by making avoidable errors.
Common mistakes include:
- Copying statistical software output directly into the thesis.
- Presenting tables without interpretation.
- Mixing discussion with results without following institutional guidelines.
- Ignoring assumptions of statistical tests.
- Reporting only p-values while omitting effect sizes or confidence intervals.
- Using inconsistent table numbering.
- Including unnecessary or repetitive charts.
- Failing to link findings to research objectives and hypotheses.
- Omitting explanations for missing data or excluded cases.
Careful proofreading and alignment with university formatting requirements can prevent these issues.
Best Practices for Writing an Outstanding Data Analysis Chapter
To produce a high-quality chapter:
- Organize results in the same order as your research objectives or hypotheses.
- Use descriptive subheadings for each analysis.
- Present only relevant tables and figures.
- Explain every important statistical finding in plain language.
- Maintain consistency in formatting and terminology.
- Clearly distinguish between statistical significance and practical significance.
- Ensure all values reported in the text match those in tables.
- Review institutional thesis guidelines before submission.
- Ask your supervisor to review the chapter before finalizing it.
- Proofread carefully to eliminate formatting and numerical errors.
Frequently Asked Questions (FAQs)
How long should the data analysis chapter be?
The length depends on your discipline, methodology, and university guidelines. In many PhD theses, the data analysis chapter ranges from 20 to 50 pages, though this can vary significantly based on the complexity of the study.
Can I include SPSS or STATA output directly?
It is generally better to summarize and format results into clear tables rather than pasting raw software output. Full outputs may be included in the appendix if required by your institution.
Should I interpret every table?
Yes. Every table or figure should be accompanied by a concise interpretation that highlights the key findings and explains their relevance to the research objectives.
Can results and discussion be combined?
Some universities and disciplines combine the results and discussion chapters, while others require them to remain separate. Always follow your university's thesis guidelines and your supervisor's recommendations.
What statistical software can be used?
Commonly used software includes SPSS, STATA, R, Python, MATLAB, SAS, AMOS, SmartPLS, and Jamovi. The choice should align with your research design and analytical requirements.
Conclusion
The data analysis chapter is the foundation upon which the conclusions of your PhD thesis are built. It transforms raw data into meaningful evidence by presenting findings in a structured, objective, and transparent manner. A well-written chapter not only demonstrates your analytical skills but also reassures readers that your conclusions are supported by rigorous and credible evidence.
Success in writing this chapter depends on more than performing statistical tests. It requires thoughtful organization, accurate interpretation, clear presentation of tables and figures, and a consistent connection between the findings, research objectives, and hypotheses. Whether your study is quantitative, qualitative, or mixed-methods, careful attention to detail and adherence to your university's guidelines will significantly strengthen your thesis.
By planning your analyses carefully, reporting results transparently, and explaining their significance in clear academic language, you can produce a data analysis chapter that enhances the overall quality of your research and increases its potential for publication in respected academic journals.
Website: www.thesislikho.com
Call/WhatsApp: +91 96438 02216