
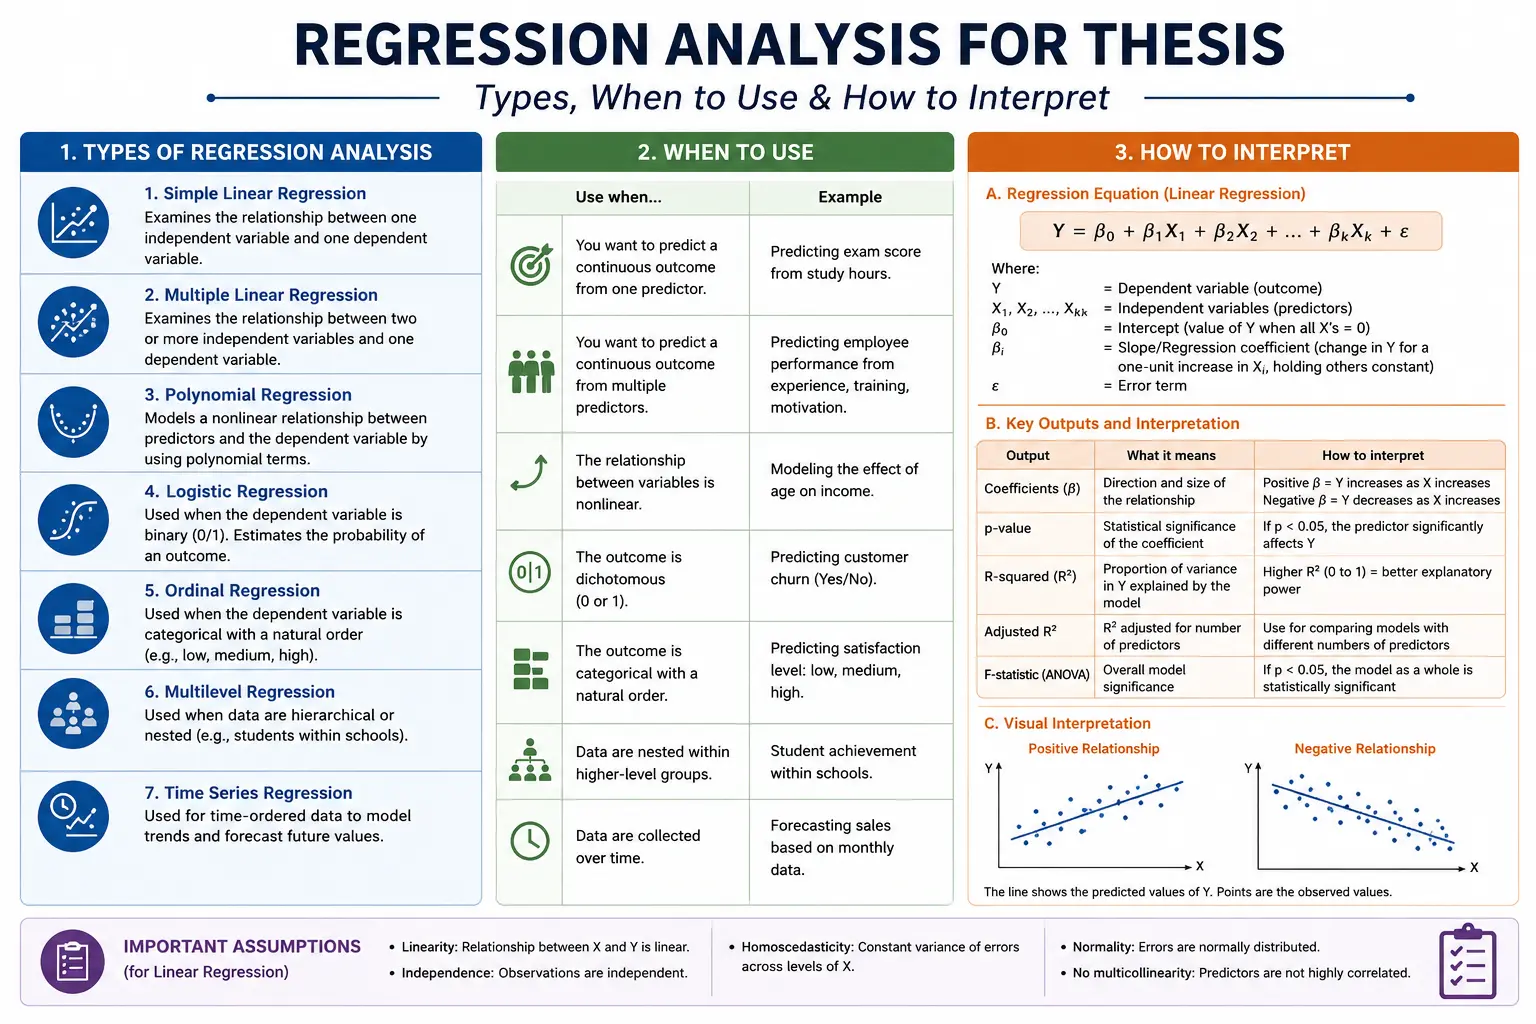
Regression analysis is one of the most widely used statistical techniques in academic research. Whether you're pursuing a master's degree or a PhD, regression analysis helps answer one of the most important research questions: How does one variable influence another?
From business and economics to public health, education, psychology, engineering, and social sciences, regression analysis enables researchers to identify relationships, make predictions, and test hypotheses using quantitative data. It is a cornerstone of evidence-based research and is frequently used in dissertations published in high-impact journals.
However, many research scholars struggle with choosing the right type of regression, understanding its assumptions, and interpreting the results correctly. Selecting an inappropriate model or misinterpreting coefficients can weaken the validity of your research findings.
In this comprehensive guide, you'll learn what regression analysis is, the different types of regression, when to use each method, how to interpret the results, common mistakes to avoid, and best practices for reporting regression analysis in your thesis.
What Is Regression Analysis?
Regression analysis is a statistical method used to examine the relationship between one dependent (outcome) variable and one or more independent (predictor) variables.
Its primary objectives are to:
- Understand the relationship between variables.
- Measure the strength and direction of associations.
- Predict future outcomes.
- Test research hypotheses.
- Identify the most influential factors affecting an outcome.
For example, a researcher may investigate:
- Does study time improve academic performance?
- How do income and education influence consumer spending?
- Does employee training increase job satisfaction?
- Can advertising expenditure predict sales revenue?
Regression analysis provides numerical evidence to answer these questions.
Why Is Regression Analysis Important for a Thesis?
Most quantitative theses aim to explain relationships rather than simply describe data. Regression analysis goes beyond descriptive statistics by allowing researchers to determine whether changes in one variable are associated with changes in another while controlling for additional factors.
Benefits of regression analysis include:
- Testing theoretical models.
- Making accurate predictions.
- Measuring effect sizes.
- Controlling confounding variables.
- Supporting evidence-based conclusions.
- Strengthening the credibility of research findings.
Because of these advantages, regression analysis is frequently required in postgraduate dissertations and doctoral theses.
Key Components of Regression Analysis
Before selecting a regression model, it's essential to understand its core elements.
Dependent Variable (Y)
The dependent variable is the outcome you want to explain or predict.
Examples:
- Sales revenue
- Student performance
- Blood pressure
- Customer satisfaction
- Employee productivity
Independent Variables (X)
Independent variables are the predictors believed to influence the dependent variable.
Examples:
- Age
- Income
- Advertising budget
- Study hours
- Work experience
A regression model can include one predictor or multiple predictors depending on the research objectives.
Types of Regression Analysis
Different research questions require different regression models. Choosing the appropriate type depends on the nature of your dependent variable and study design.
1. Simple Linear Regression
Simple linear regression examines the relationship between one independent variable and one continuous dependent variable.
Example
Research Question:
Does study time affect students' exam scores?
Dependent Variable:
- Exam score
Independent Variable:
- Study hours
When to Use
- One predictor variable.
- Continuous dependent variable.
- Linear relationship between variables.
Advantages
- Easy to interpret.
- Ideal for introductory quantitative research.
- Useful for prediction and hypothesis testing.
2. Multiple Linear Regression
Multiple regression evaluates the impact of two or more independent variables on a continuous dependent variable.
Example
Can exam scores be predicted by:
- Study hours
- Attendance
- Sleep duration
- Previous GPA
When to Use
- Multiple predictor variables.
- Continuous outcome variable.
- Researchers want to control for several factors simultaneously.
Benefits
- More realistic models.
- Higher predictive accuracy.
- Helps identify the most influential predictors.
3. Logistic Regression
Logistic regression is used when the dependent variable is categorical, typically with two possible outcomes.
Example
Will a patient recover?
- Yes
- No
Will a student pass?
- Pass
- Fail
Common Applications
- Medical diagnosis
- Customer churn prediction
- Fraud detection
- Employment selection
- Disease risk assessment
Unlike linear regression, logistic regression estimates probabilities rather than predicting continuous values.
4. Ordinal Logistic Regression
This model is appropriate when the dependent variable has ordered categories.
Examples include:
- Customer satisfaction (Low, Medium, High)
- Education level
- Pain severity
- Service quality ratings
Ordinal logistic regression accounts for the natural order of categories while estimating relationships.
5. Multinomial Logistic Regression
Use this model when the dependent variable has more than two categories without a natural order.
Examples:
- Preferred transportation (Car, Bus, Train, Bicycle)
- Brand preference
- Career choice
- Political party preference
6. Poisson Regression
Poisson regression is suitable for count data.
Examples:
- Number of accidents
- Number of hospital visits
- Number of publications
- Daily customer arrivals
This model assumes the dependent variable represents non-negative integer counts.
7. Ridge Regression
When predictor variables are highly correlated, multicollinearity can reduce the reliability of regression estimates.
Ridge regression addresses this issue by introducing a penalty that stabilizes coefficient estimates.
It is particularly useful for datasets with many correlated predictors.
8. Lasso Regression
Lasso regression not only handles multicollinearity but also performs automatic variable selection by shrinking some coefficients to zero.
It is widely used for:
- High-dimensional datasets
- Feature selection
- Predictive modeling
9. Polynomial Regression
Sometimes relationships between variables are curved rather than linear.
Polynomial regression models these nonlinear relationships.
Example:
The relationship between work experience and salary may increase rapidly initially before leveling off later in a career.
Assumptions of Linear Regression
Before interpreting regression results, verify that the model assumptions are satisfied.
1. Linearity
The relationship between predictors and the outcome should be approximately linear.
2. Independence of Observations
Each observation should be independent of the others.
3. Homoscedasticity
The variance of residuals should remain relatively constant across all levels of the predictors.
4. Normality of Residuals
Residuals (prediction errors) should follow an approximately normal distribution.
5. No Multicollinearity
Independent variables should not be excessively correlated.
Researchers often assess this using the Variance Inflation Factor (VIF).
6. No Significant Outliers
Extreme observations can distort regression estimates.
Diagnostic plots and influence statistics help identify influential outliers.
Steps to Perform Regression Analysis
Step 1: Define Your Research Question
Clearly identify:
- Dependent variable
- Independent variables
- Expected relationships
Step 2: Collect Data
Ensure:
- Adequate sample size
- Reliable measurements
- Minimal missing data
Step 3: Clean the Dataset
Before analysis:
- Remove duplicate records.
- Handle missing values.
- Check for coding errors.
- Identify outliers.
Step 4: Explore the Data
Conduct:
- Descriptive statistics
- Correlation analysis
- Scatter plots
- Distribution checks
This helps determine whether regression is appropriate.
Step 5: Run the Regression Model
Statistical software commonly used includes:
- SPSS
- STATA
- R
- Python
- SAS
- Jamovi
Step 6: Evaluate Model Assumptions
Check:
- Residual plots
- Normality tests
- VIF values
- Independence diagnostics
Step 7: Interpret the Results
Focus on:
- Regression coefficients
- P-values
- Confidence intervals
- R-squared
- Adjusted R-squared
- F-statistic
How to Interpret Regression Output
Understanding regression output is just as important as running the analysis.
Regression Coefficients (β)
The regression coefficient indicates how much the dependent variable changes when the predictor increases by one unit, holding other variables constant.
Example:
β = 2.5
Interpretation:
Every additional hour of study is associated with an average increase of 2.5 exam marks, assuming other variables remain unchanged.
P-value
The p-value determines whether a predictor is statistically significant.
General guideline:
- p < 0.05 → Statistically significant.
- p ≥ 0.05 → Not statistically significant.
A significant p-value suggests evidence of an association, though practical importance should also be considered.
R-Squared (R²)
R² indicates the proportion of variance in the dependent variable explained by the model.
Example:
R² = 0.72
Interpretation:
The model explains 72% of the variation in the outcome.
Higher values generally indicate better explanatory power, but context matters.
Adjusted R-Squared
Adjusted R² accounts for the number of predictors included in the model.
It is particularly useful when comparing models with different numbers of independent variables.
F-Test
The F-test evaluates whether the regression model, as a whole, provides a better fit than a model with no predictors.
A significant F-test indicates that the set of predictors collectively explains a meaningful amount of variation in the outcome.
Example of Regression Interpretation
Suppose your thesis examines the impact of study habits on academic performance.
Results:
- Study Hours: β = 3.2, p = 0.001
- Attendance: β = 1.5, p = 0.020
- Sleep Duration: β = 0.40, p = 0.210
- R² = 0.68
Interpretation:
The model explains 68% of the variation in exam scores. Study hours and attendance are statistically significant positive predictors of academic performance. Sleep duration shows a positive coefficient but is not statistically significant in this model, suggesting insufficient evidence that it independently predicts exam scores after accounting for the other variables.
Common Mistakes in Regression Analysis
Many thesis writers encounter avoidable errors, including:
- Choosing an inappropriate regression model.
- Ignoring regression assumptions.
- Misinterpreting coefficients as proof of causation.
- Focusing only on p-values while overlooking effect sizes.
- Ignoring multicollinearity among predictors.
- Overfitting models with too many variables.
- Failing to report diagnostic tests.
- Omitting confidence intervals and measures of model fit.
Avoiding these mistakes improves the validity and transparency of your research.
Best Practices for Reporting Regression in Your Thesis
A strong methodology and results section should include:
- The regression model selected and why it was appropriate.
- Definitions of dependent and independent variables.
- Sample size.
- Assumption checks and diagnostic results.
- Regression coefficients with confidence intervals.
- Standard errors.
- P-values.
- R² and Adjusted R² values.
- Interpretation of statistically and practically significant findings.
- Limitations of the model.
Clear reporting enables readers, supervisors, and journal reviewers to assess the quality and reproducibility of your analysis.
Frequently Asked Questions (FAQs)
Which regression is most commonly used in a thesis?
Multiple linear regression is among the most commonly used methods because many research questions involve examining the influence of several independent variables on one continuous outcome.
What sample size is required for regression analysis?
The required sample size depends on the number of predictors, expected effect sizes, and desired statistical power. Larger samples generally produce more stable and reliable estimates.
Can regression analysis prove causation?
No. Regression identifies statistical associations. Demonstrating causation requires an appropriate research design, such as randomized experiments or strong quasi-experimental methods, along with careful control of confounding factors.
Which software is best for regression analysis?
Popular options include SPSS, STATA, R, Python, SAS, and Jamovi. The best choice depends on your discipline, statistical requirements, and familiarity with the software.
Conclusion
Regression analysis is one of the most valuable statistical tools for quantitative thesis research. It enables researchers to understand relationships between variables, evaluate theoretical models, identify significant predictors, and make informed predictions based on data.
The key to successful regression analysis lies in selecting the appropriate model, ensuring that its assumptions are met, interpreting coefficients correctly, and reporting findings transparently. Whether you use simple linear regression for a basic relationship, multiple regression to account for several predictors, or logistic regression for categorical outcomes, each method serves a specific research purpose.
By mastering regression analysis and applying it thoughtfully, you can produce stronger evidence, enhance the credibility of your thesis, and contribute meaningful insights to your academic field. A well-executed regression analysis not only strengthens your dissertation but also prepares you for publishing in peer-reviewed journals and conducting high-quality research throughout your career.
Website: www.thesislikho.com
Call/WhatsApp: +91 96438 02216