
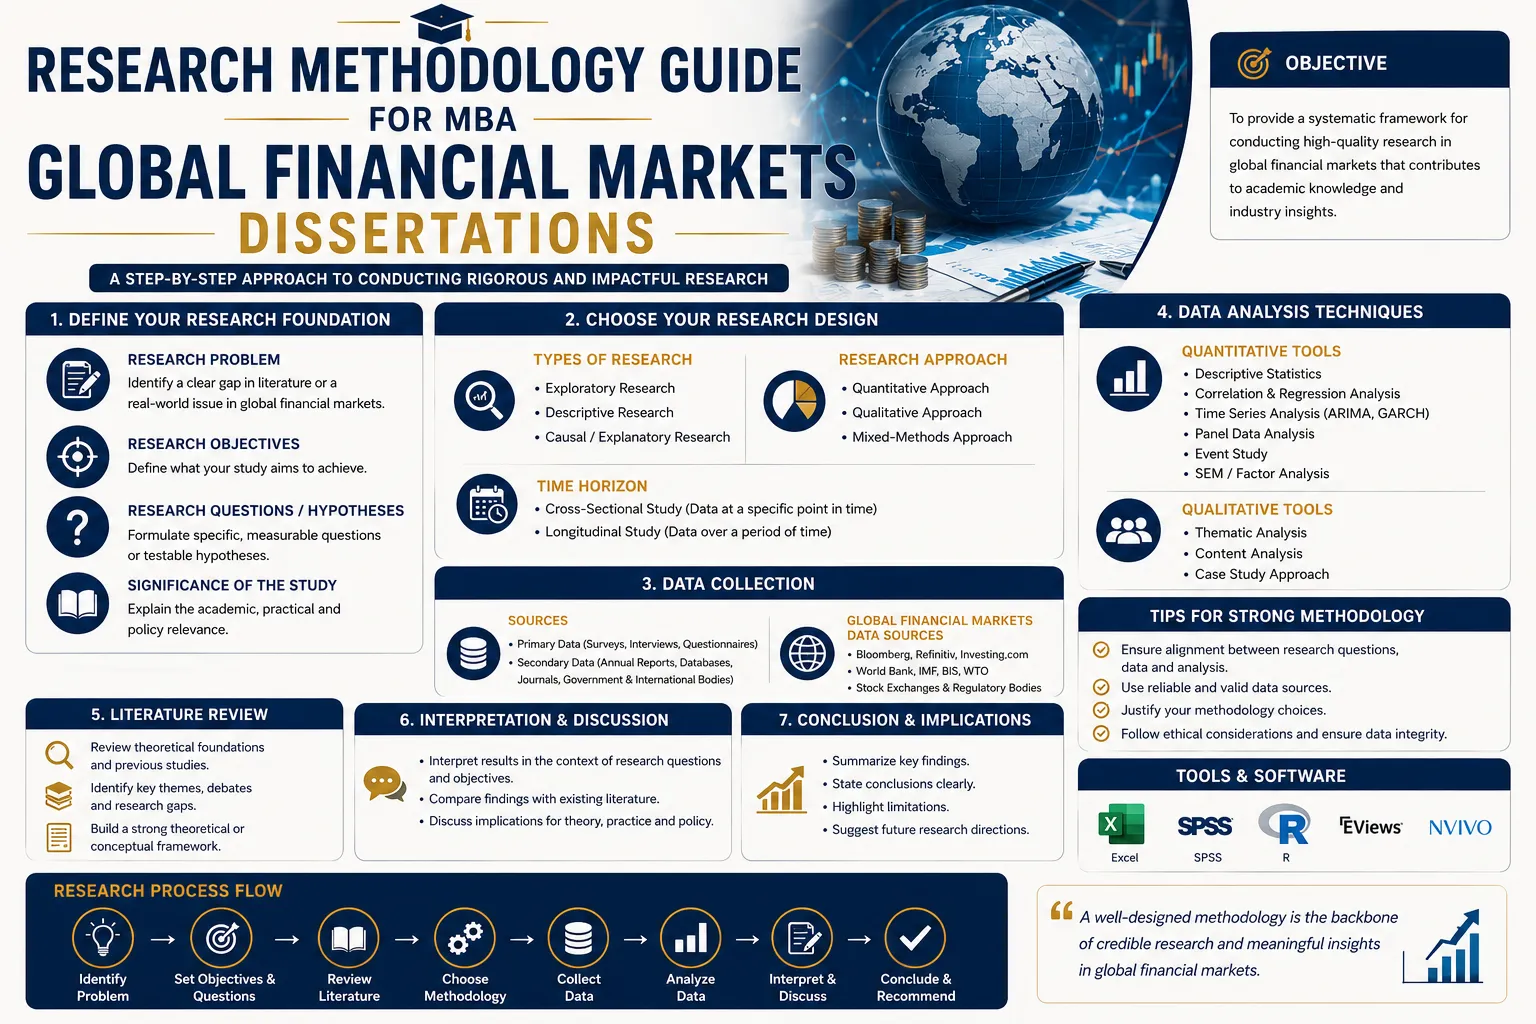
A finance dissertation has a particular way of humbling first-time researchers: you can have a genuinely interesting question — does a specific event move markets, does sentiment predict volatility, does a trading strategy actually outperform — and still watch it stall completely at Chapter 3, because financial markets research runs on a fairly specific toolkit that most MBA scholars haven't been formally trained in.
This guide walks through a research methodology guide for MBA global financial markets dissertations the way an experienced finance research supervisor would — practically, without assuming you already know what an event window is or why anyone would bother modeling volatility separately from returns. If you're a first-time PhD or MBA thesis writer without a strong quantitative research background, this is written specifically for you.
At ThesisLikho, our PhD-qualified mentors have guided more than 10,000 scholars through methodology design, data collection planning, and analysis strategy across MBA, PhD, and other research programmes, including finance and financial markets. What follows draws on that mentoring experience, shaped specifically for global financial markets dissertations in the Indian academic context.
Why Financial Markets Dissertations Need a Different Methodology Playbook
Most MBA methodology guidance defaults to survey design, interviews, and case studies — genuinely appropriate for organizational behavior or marketing research, but a poor fit for a dissertation asking whether a specific announcement moved stock prices, or whether volatility spikes during a geopolitical crisis. Financial markets research is fundamentally quantitative time-series work, built on daily or intraday price data rather than survey responses, and it draws on a specific, well-established set of techniques developed within financial econometrics rather than general business research methods.
This distinction matters from the very first page of your methodology chapter. A finance dissertation examiner isn't going to be looking for a Likert-scale survey instrument or an interview protocol — they're going to be checking whether you've chosen an appropriate model for your specific question, whether your data window and sample are defensible, and whether you've accounted for the statistical properties that make financial data genuinely different from typical business survey data.
2. What a Financial Markets Methodology Chapter Actually Needs to Contain
A financial markets dissertation methodology chapter typically covers: your research design (event study, time-series volatility analysis, cross-sectional comparison, or a combination), your data sources and sample period with clear justification, your specific model or test (event study with a chosen benchmark model, a GARCH-family volatility model, a regression framework), your hypotheses stated in testable form, and a section addressing the statistical properties of financial data your chosen method needs to account for — non-normality, volatility clustering, and autocorrelation chief among them.
Unlike a qualitative MBA dissertation chapter, this one leans heavily on precision: your event window, your estimation window, your specific model specification, and your significance testing approach all need to be stated explicitly and numerically, not described in general terms. A methodology chapter that says "an event study was conducted" without specifying the event window length, the benchmark model used, and the significance test applied hasn't actually specified a methodology yet.
3. Event Study Methodology: The Workhorse of Financial Markets Research
If your dissertation examines how markets react to a specific event — a policy announcement, an earnings release, a geopolitical shock, a regulatory change — event study methodology is very likely your core tool, and it's worth understanding its actual mechanics rather than treating it as a black box.
The core logic: you define an event date, then measure the "abnormal return" around that date — the difference between the stock or index's actual return and what a benchmark model predicts it would have earned in the absence of the event. Common benchmark models include the market model (a simple regression of the stock's return against a broad market index), the market-adjusted model (using market return directly as the expected return), the Capital Asset Pricing Model, and, for more rigorous work, multi-factor models like the Fama-French three-factor model, which accounts for size and value effects the simpler models miss.
A few specific design decisions you'll need to make and justify explicitly:
- Your estimation window — the period before the event used to estimate your benchmark model's parameters, commonly 100 to 250 trading days, chosen to be long enough for stable parameter estimates but not so long that market conditions have shifted meaningfully.
- Your event window — the period around the event date over which you measure abnormal returns, ranging from a single day to several weeks depending on your research question; shorter windows better isolate the event's specific effect, while longer windows capture delayed market reactions at the cost of more noise from other confounding events.
- Your aggregation approach — whether you're calculating cumulative abnormal returns (summed across the event window) or average abnormal returns (averaged across your sample of events or firms), and your statistical test for significance (commonly a t-test on cumulative abnormal returns, though more robust tests exist for dealing with cross-sectional correlation among your sample firms).
4. Volatility Modeling: Why Returns and Risk Need Separate Treatment
A distinctive feature of financial data — one that surprises many first-time researchers — is that returns and volatility (risk) need to be modeled separately, because financial return volatility isn't constant over time; it clusters, with turbulent periods followed by more turbulent periods and calm periods followed by more calm ones. Standard regression techniques that assume constant variance simply don't capture this behavior well.
This is where GARCH (Generalized Autoregressive Conditional Heteroskedasticity) models come in — the standard family of tools for modeling and forecasting financial volatility. A basic GARCH(1,1) model estimates current volatility as a function of the previous period's volatility and the previous period's squared return shock, capturing exactly the clustering behavior standard models miss. For dissertations examining more nuanced volatility dynamics, extended variants are widely used: EGARCH captures asymmetric effects (the common finding that negative shocks increase volatility more than positive shocks of the same size), GJR-GARCH similarly models this asymmetry through a different specification, and multivariate GARCH models allow you to study volatility spillovers — how volatility in one market or asset transmits to another, a genuinely useful design for a dissertation with "global" or cross-market ambitions specifically.
If your dissertation combines an event study with a volatility question — for instance, examining both the price reaction and the volatility impact of a specific event — combining a market-model event study with a GARCH-based volatility analysis over the same period is a well-established, defensible pairing, and one you'll find used across recent published research on market reactions to crises and major announcements.
5. Time Series Considerations Specific to Financial Data
Beyond volatility clustering, financial time series carry a few other statistical properties your methodology needs to explicitly account for, since ignoring them undermines your results' validity even if your model choice is otherwise sound:
- Non-normality of returns — financial returns typically exhibit "fat tails," meaning extreme events occur more often than a normal distribution would predict. Many GARCH implementations allow you to specify a Student-t distribution rather than a normal distribution for exactly this reason, and stating this choice explicitly (and why) strengthens your methodology's rigor.
- Stationarity — most time series techniques require your data to be stationary (its statistical properties don't change over time), which raw price levels typically aren't; working with returns (percentage changes) rather than raw prices is the standard fix, and running a formal unit root test (commonly the Augmented Dickey-Fuller test) to confirm stationarity before proceeding is standard, expected practice.
- Autocorrelation — financial returns can show serial correlation, particularly in less liquid or emerging markets, which affects the validity of standard significance tests; checking for this and using autocorrelation-robust standard errors where needed is worth building into your analysis plan from the outset rather than discovering the issue after running your main tests.
6. Choosing Your Data Sources and Sample Period
Data source selection is a genuinely consequential methodological decision in financial markets research, and it needs explicit justification in your chapter:
- For Indian market data: NSE and BSE both provide historical price data, often the most directly accessible option for Indian-market-focused dissertations, alongside commercial databases many Indian universities provide institutional access to.
- For global or cross-market data: Bloomberg and Refinitiv (formerly Thomson Reuters/Datastream) are the standard commercial sources used across the finance literature, though access depends on your university's subscriptions; free alternatives like Yahoo Finance or Investing.com are commonly used in academic research when institutional access isn't available, though it's worth noting their data quality and completeness in your limitations section if used.
- Your sample period needs explicit justification tied to your research question — a study of COVID-19's market impact needs a period spanning both the pre-event baseline and the event itself; a study of long-run volatility patterns needs a considerably longer window to capture multiple market cycles.
- Frequency of data — daily data is the standard default for event studies and most GARCH applications; intraday data offers more precision for very short event windows but is harder to access and considerably more complex to clean and process, a trade-off worth weighing honestly against your actual timeline and data access.
7. Cross-Market and Comparative Study Design
Given the "global" framing many financial markets dissertations carry, a comparative design — examining how the same event or phenomenon plays out across an emerging versus a developed market, or across multiple regional indices — is a common and genuinely strong structure, provided it's designed deliberately rather than added as an afterthought.
A well-designed comparative study needs: consistent methodology applied identically across each market studied (the same event window, benchmark model, and significance tests), a clear rationale for why the specific markets compared are meaningful (an emerging-versus-developed contrast, for instance, needs justification tied to your research question, not just convenient data availability), and explicit discussion of confounding differences between markets (trading hours, market maturity, liquidity, regulatory environment) that might explain observed differences independent of your actual variable of interest.
8. Sentiment, News, and Alternative Data in Modern Financial Research
An increasingly active and genuinely novel-friendly direction in financial markets research combines classical econometric methods with sentiment or textual data — extracting sentiment scores from news coverage or social media using natural language processing tools, then examining the relationship between that sentiment and market volatility or returns, often using a GARCH model enhanced to incorporate the sentiment variable directly.
This hybrid approach is genuinely well suited to an MBA dissertation aiming for a distinctive, less-saturated angle: rather than another standalone event study, combining sentiment extraction (using an established NLP model) with a GARCH-based volatility analysis over the same period offers a more novel, integrative contribution, provided you have the technical capacity to handle both components — or can access existing sentiment datasets or pre-trained models rather than building sentiment extraction entirely from scratch.
9. Data Analysis Software and Tools
- Excel — sufficient for smaller, simpler event studies with straightforward abnormal return calculations, though it becomes unwieldy for GARCH modeling or larger datasets.
- R — widely used in academic financial econometrics, with well-established packages specifically built for event studies and GARCH modeling; a strong choice if you're comfortable with a scripting environment or willing to invest the learning time.
- Python — increasingly common, particularly for dissertations combining classical econometrics with sentiment analysis or machine learning components, given its strong library support for both financial modeling and NLP.
- EViews or Stata — widely used in finance and economics departments specifically for time series econometrics, often with a gentler learning curve than R or Python for scholars newer to coding, and commonly available through university licenses.
Whichever tool you choose, confirm your department's typical software and your own realistic learning timeline before committing — GARCH modeling in particular has a real technical learning curve if you're starting from limited statistical software experience, and this is worth discussing honestly with your supervisor at the proposal stage rather than discovering the gap mid-analysis.
If you'd like structured support matching your research question to a feasible, well-specified methodology, our MBA Thesis Assistance service works through exactly this stage with scholars.
10. Step-by-Step Guide to Writing Your Methodology Chapter
- Restate your research question and hypotheses in precise, testable form at the top of the chapter.
- State your overall research design (event study, volatility analysis, comparative cross-market study, or a combination) with a one-paragraph justification tied to your specific question.
- Specify your data sources, sample period, frequency, and any data cleaning steps, with an explicit rationale for each choice.
- Detail your specific model or test — benchmark model for event studies, GARCH specification for volatility work — including the exact parameters (window lengths, distributional assumptions) you're using.
- Address the statistical properties of financial data your method needs to account for (non-normality, stationarity, autocorrelation) and how you're handling each.
- State your significance testing approach explicitly.
- Note your software and tools, and briefly justify the choice if it's not your department's obvious default.
- Cross-check that every method chosen here is something you can realistically execute given your data access and your own technical preparation — this step catches over-ambitious designs before they become a submission-deadline problem.
11. Common Mistakes First-Time Writers Make
- Describing an event study vaguely without specifying the event window, estimation window, benchmark model, or significance test — each of these needs an explicit, numerically stated choice.
- Ignoring volatility clustering entirely, applying standard regression techniques to financial return data without checking whether a GARCH-family model is actually more appropriate for the research question.
- Skipping stationarity testing, working directly with raw price levels rather than returns, and running time series techniques that assume stationarity without ever checking whether that assumption holds.
- Choosing a "global" comparative design without a clear rationale for the specific markets compared, beyond simple data convenience.
- Underestimating the technical learning curve for GARCH modeling or NLP-based sentiment extraction, committing to a methodology beyond realistic reach given the remaining timeline.
- Treating data source selection as an afterthought, rather than a methodological decision requiring explicit justification and acknowledgment of any data quality limitations.
- Overstating causal claims from an event study — a significant abnormal return around an event demonstrates association with market reaction, not proof that the event alone caused every subsequent price movement, and precise language here matters.
12. Two Realistic Case Studies
Case Study 1 — Combining Event Study and GARCH for a Crisis-Focused Dissertation
An MBA scholar researching the impact of a geopolitical crisis on global financial markets initially planned a simple event study measuring abnormal returns around the crisis's onset. After reviewing recent published research on similar crisis events, the scholar's supervisor suggested pairing the event study with a GARCH(1,1) volatility analysis over an extended window spanning both the crisis period and a comparable prior period, allowing the dissertation to examine both the immediate price reaction and the longer volatility impact. This combination — rather than either technique alone — produced a considerably richer, better-grounded set of findings and matched the kind of methodological pairing seen across recent published work on market reactions to major shocks.
Case Study 2 — Choosing a Feasible Comparative Design Given Data Access Constraints
A first-time MBA thesis writer wanted to compare market reactions to a specific regulatory announcement across five different countries, but discovered that consistent, high-quality data access across all five markets wasn't realistically achievable given the university's data subscriptions and the remaining timeline. Rather than abandoning the comparative angle entirely, the scholar narrowed the design to two markets — one emerging, one developed — where reliable data access was confirmed, and built a clear rationale for the emerging-versus-developed contrast directly into the research question. The narrower, better-supported comparison produced a more defensible, completable dissertation than the original five-market design would have allowed within the same timeframe.
If your topic idea resembles either of these scenarios, our MBA Thesis Assistance service can help you match your research question to a feasible, well-specified methodology before you present it to your guide.
FAQs
What is a research methodology guide for MBA global financial markets dissertations?
It's a structured approach to designing the methodology chapter of a financial markets-focused MBA dissertation — covering event study design, volatility modeling using GARCH-family models, time series considerations specific to financial data, and data source selection, all justified against your specific research question.
Why does research methodology matter this much for a financial markets MBA thesis?
Because financial markets research relies on a specific, well-established econometric toolkit rather than general business research methods, and a mismatch between your research question and your chosen technique — or ignoring statistical properties like volatility clustering and non-stationarity — can undermine your findings' validity even when the underlying research question is strong.
How does this approach affect an MBA thesis in practice?
Scholars who select and precisely specify an appropriate methodology (event study, GARCH-based volatility modeling, or a combination) — while explicitly accounting for the statistical properties of financial data — typically face fewer guide revisions and produce a results chapter that holds up to closer statistical scrutiny.
How long does it take to complete an MBA thesis using this approach?
Most Indian MBA dissertations run within a single semester (commonly the fourth). Financial markets dissertations using established data sources and well-specified event study or GARCH methodology can often be completed efficiently once the technical approach is confirmed early, though scholars new to econometric software should budget real learning time before committing to a technically ambitious design.
Is professional help available for research methodology guide for MBA global financial markets dissertations?
Yes — methodology design support, including matching your research question to a feasible econometric approach and data source, is available through services such as MBA Thesis Assistance.
Ready to design a financial markets methodology your guide will approve on the first try? Get Free MBA Thesis Consultation with ThesisLikho's PhD-qualified mentors.