
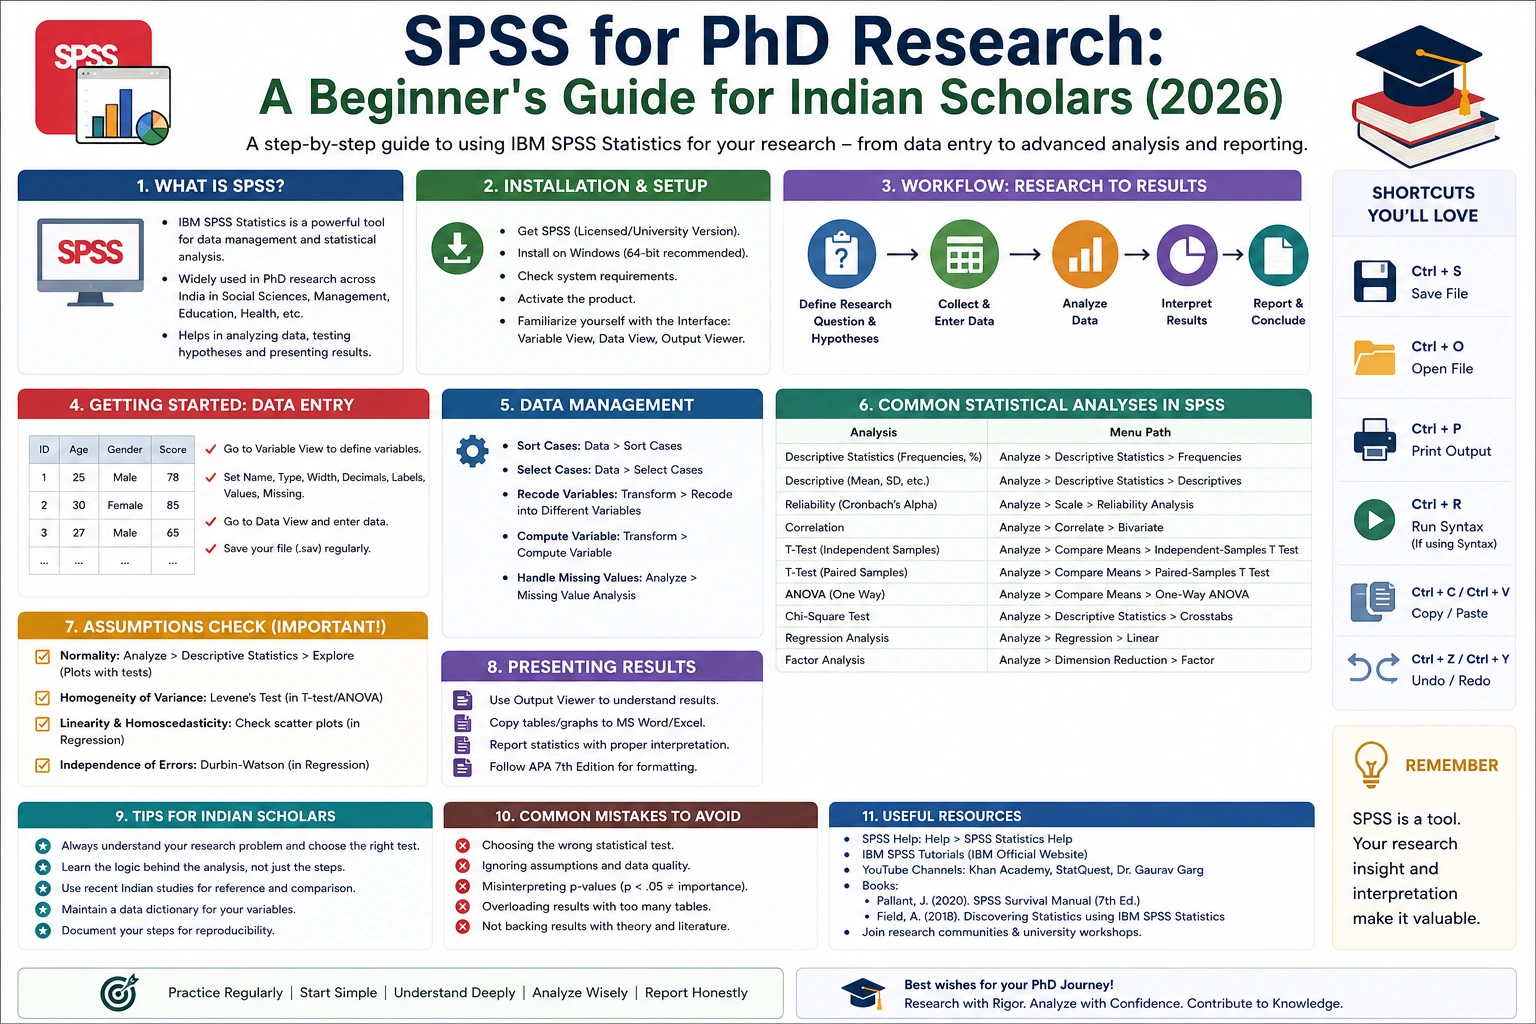
Statistical analysis is one of the most important stages of any quantitative PhD research project. After collecting data through surveys, experiments, questionnaires, or observational studies, researchers must analyze the information accurately to answer research questions, test hypotheses, and draw meaningful conclusions. This is where IBM SPSS Statistics, commonly known as SPSS, becomes an indispensable tool.
For decades, SPSS has remained one of the most widely used statistical software applications in universities, research institutions, healthcare organizations, and businesses worldwide. In India, it is extensively used by PhD scholars in management, education, psychology, healthcare, nursing, social sciences, economics, and other disciplines because of its user-friendly interface and powerful analytical capabilities.
Unlike programming-based statistical software, SPSS enables researchers to perform complex analyses through menus and dialog boxes, making it particularly suitable for beginners. Whether you need to calculate descriptive statistics, conduct regression analysis, perform ANOVA, test reliability, or analyze survey data, SPSS offers a comprehensive set of tools to support your research.
If you are beginning your doctoral journey and wondering how SPSS fits into the research process, this guide will explain everything you need to know—from its features and applications to data analysis, interpretation, advantages, limitations, and best practices for Indian PhD scholars.
What Is SPSS?
IBM SPSS Statistics is a statistical software package designed for data management, statistical analysis, and reporting. Originally developed as the Statistical Package for the Social Sciences, SPSS has evolved into a versatile analytical platform used across many academic and professional disciplines.
SPSS allows researchers to:
- Enter and organize data
- Clean datasets
- Perform descriptive and inferential statistics
- Test hypotheses
- Create charts and graphs
- Generate statistical reports
- Export results for thesis writing and publication
Its intuitive graphical interface makes it one of the easiest statistical software tools for beginners.
Why Is SPSS Popular Among PhD Scholars in India?
Many Indian universities recommend SPSS because it combines ease of use with comprehensive statistical capabilities.
Some of the main reasons for its popularity include:
- Minimal programming knowledge required
- Wide acceptance in universities
- Support for a broad range of statistical techniques
- Easy data management
- Reliable output for academic research
- Extensive learning resources and tutorials
- Compatibility with Microsoft Excel and other common file formats
For scholars conducting quantitative research, SPSS provides a practical balance between simplicity and analytical power.
Which Research Fields Commonly Use SPSS?
SPSS is suitable for a wide variety of academic disciplines.
It is commonly used in:
- Management
- Education
- Psychology
- Healthcare
- Nursing
- Sociology
- Social Work
- Economics
- Public Administration
- Marketing
- Human Resource Management
- Tourism and Hospitality
- Agriculture
- Public Health
Although engineering and computer science researchers often prefer programming-based tools such as Python or MATLAB, SPSS remains highly relevant for behavioral, social, and business research.
Key Features of SPSS
SPSS provides numerous features that simplify the research process.
1. Data Entry and Management
Researchers can enter data manually or import it from:
- Microsoft Excel
- CSV files
- Text files
- Databases
- Other statistical software
SPSS also supports variable labels, value labels, missing value coding, and data transformations.
2. Descriptive Statistics
Descriptive statistics summarize data using measures such as:
- Mean
- Median
- Mode
- Standard deviation
- Variance
- Frequency
- Percentage
- Minimum and maximum values
These analyses help researchers understand the basic characteristics of their data before conducting inferential tests.
3. Data Visualization
SPSS can generate various charts, including:
- Bar charts
- Pie charts
- Histograms
- Box plots
- Scatter plots
- Line graphs
Well-designed visualizations make research findings easier to interpret and present.
4. Hypothesis Testing
SPSS supports many commonly used statistical tests, including:
- t-tests
- ANOVA
- Chi-square tests
- Correlation analysis
- Regression analysis
- Non-parametric tests
These procedures help researchers evaluate whether observed patterns are statistically significant.
5. Reliability Analysis
Researchers frequently use Cronbach's Alpha in SPSS to evaluate the internal consistency of questionnaire scales.
Reliability testing is an essential step before analyzing survey-based research data.
6. Factor Analysis
SPSS supports:
- Exploratory Factor Analysis (EFA)
- Principal Component Analysis (PCA)
These techniques help identify underlying dimensions within survey data and are commonly used during scale development and validation.
SPSS Interface Explained
The SPSS interface is designed to resemble a spreadsheet, making it familiar to new users.
It consists of three primary components.
Data View
Data View displays the dataset, where:
- Each row represents one participant or observation.
- Each column represents one variable.
Researchers enter or import data in this view.
Variable View
Variable View defines the properties of each variable.
Information includes:
- Variable name
- Data type
- Label
- Measurement level
- Missing value codes
- Value labels
Proper variable definition ensures accurate analysis.
Output Viewer
The Output Viewer displays:
- Statistical tables
- Charts
- Test results
- Model summaries
Researchers can export these outputs to Word, PDF, or other formats for reporting.
Types of Data You Can Analyze in SPSS
SPSS can analyze various forms of quantitative data.
Examples include:
- Survey responses
- Questionnaire data
- Experimental results
- Clinical trial data
- Educational assessments
- Organizational data
- Government datasets
The software supports both cross-sectional and longitudinal studies.
Common Statistical Tests in SPSS
Descriptive Statistics
Used to summarize data characteristics.
Typical applications include demographic analysis and preliminary data exploration.
Correlation Analysis
Examines the strength and direction of relationships between variables.
Researchers often use Pearson or Spearman correlation depending on the nature of the data.
Regression Analysis
Regression investigates how one or more independent variables influence a dependent variable.
Applications include:
- Employee performance prediction
- Customer satisfaction modeling
- Academic achievement analysis
Independent Samples t-Test
Compares the means of two independent groups.
Example:
Comparing job satisfaction between trained and untrained employees.
ANOVA
Analyzes differences among three or more groups.
Example:
Comparing customer satisfaction across multiple regions.
Chi-Square Test
Examines associations between categorical variables.
Example:
Investigating whether educational qualification is associated with employment sector.
Reliability Analysis
Cronbach's Alpha evaluates whether questionnaire items consistently measure the intended construct.
Reliable scales strengthen the credibility of research findings.
Step-by-Step Process for Using SPSS
Following a structured workflow improves analytical accuracy.
Step 1: Plan Your Research
Before opening SPSS:
- Define research questions.
- Develop hypotheses.
- Identify variables.
- Select appropriate statistical tests.
The analysis should be driven by your research objectives rather than the software itself.
Step 2: Prepare Your Dataset
Ensure your data are:
- Complete
- Correctly coded
- Free from duplicate entries
- Properly labeled
Good data preparation reduces errors during analysis.
Step 3: Import or Enter Data
Data can be:
- Entered manually.
- Imported from Excel.
- Loaded from CSV or database files.
Review imported data carefully to confirm that variables have been interpreted correctly.
Step 4: Clean the Data
Before analysis:
- Check for missing values.
- Identify outliers.
- Correct coding errors.
- Verify variable types.
- Assess data quality.
High-quality data lead to more reliable statistical results.
Step 5: Run Statistical Analyses
Select statistical procedures that align with your research questions.
For example:
- Descriptive statistics for summarizing data.
- Correlation for examining relationships.
- Regression for prediction.
- ANOVA for comparing multiple groups.
Avoid choosing tests simply because they are available in the software.
Step 6: Interpret the Results
SPSS provides numerical output, but interpretation requires statistical understanding.
Explain:
- What the results mean.
- Whether hypotheses are supported.
- The practical implications of the findings.
Interpretation should be written in clear academic language.
Advantages of Using SPSS
SPSS offers many benefits for doctoral researchers.
Easy to Learn
Researchers with limited programming experience can quickly become productive.
Comprehensive Statistical Tools
SPSS includes most statistical techniques required for master's and PhD research.
Reliable Output
The software is widely trusted in academia and industry.
Strong Documentation
Thousands of books, online courses, and tutorials are available to support learning.
Integration with Other Tools
SPSS integrates with:
- AMOS for Structural Equation Modeling (SEM)
- Excel for data import/export
- Various database systems
This flexibility supports more advanced research workflows.
Limitations of SPSS
Despite its strengths, SPSS has limitations.
Commercial Licensing
Individual licenses can be costly, although many universities provide institutional access.
Limited Customization
Compared with programming languages, SPSS offers fewer opportunities for advanced customization.
Less Suitable for AI and Machine Learning
Researchers working in artificial intelligence or deep learning often prefer Python.
Reproducibility
Although SPSS supports syntax, many users rely solely on the graphical interface, which may make fully reproducible workflows more challenging if syntax is not saved and documented.
Common Mistakes Beginners Make
Many first-time users encounter similar problems.
Examples include:
- Entering data incorrectly.
- Ignoring missing values.
- Choosing inappropriate statistical tests.
- Misinterpreting p-values.
- Reporting software output without explanation.
- Failing to check statistical assumptions.
- Using inconsistent variable coding.
Taking time to understand the fundamentals of statistics helps avoid these errors.
Best Practices for Using SPSS
To improve your research quality:
- Learn basic statistics before learning the software.
- Plan your analyses before collecting data.
- Maintain a well-organized dataset.
- Label variables clearly.
- Save both data files and syntax where possible.
- Verify assumptions before running statistical tests.
- Interpret findings rather than copying SPSS output directly.
- Back up your project regularly.
These practices contribute to transparent and reliable research.
Frequently Asked Questions (FAQs)
Is SPSS suitable for beginners?
Yes. SPSS is widely regarded as one of the most beginner-friendly statistical software packages because of its graphical interface and straightforward workflow.
Do I need programming knowledge to use SPSS?
No. Most analyses can be completed using menus and dialog boxes. However, learning SPSS syntax can improve efficiency and reproducibility.
Can SPSS handle large datasets?
SPSS can manage many research datasets effectively. Extremely large or computationally intensive datasets may be better suited to programming-based platforms such as R or Python.
Is SPSS enough for a PhD thesis?
For many quantitative research projects in management, education, psychology, healthcare, and the social sciences, SPSS provides all the statistical tools needed. More specialized research may require additional software such as AMOS, R, Python, or STATA.
Should I learn SPSS or Python first?
If you are new to quantitative research and your thesis relies on conventional statistical analysis, SPSS is often a practical starting point. If your long-term interests include data science, automation, or artificial intelligence, learning Python afterward can broaden your analytical skills.
Conclusion
SPSS continues to be one of the most trusted statistical software tools for PhD research because it combines ease of use with a comprehensive range of analytical capabilities. From organizing survey data and conducting descriptive statistics to performing regression analysis, reliability testing, ANOVA, and hypothesis testing, SPSS provides researchers with the tools needed to analyze quantitative data confidently and efficiently.
For Indian PhD scholars beginning their research journey in 2026, SPSS offers an accessible entry point into statistical analysis without requiring extensive programming knowledge. However, the software is only as effective as the researcher's understanding of statistical principles. By learning the fundamentals of research design, selecting appropriate statistical methods, preparing high-quality datasets, and interpreting results thoughtfully, scholars can use SPSS to produce rigorous, credible, and publication-ready research that meets university standards and contributes meaningful knowledge to their field.
Website: www.thesislikho.com
Call / WhatsApp: +91-96438 02216