
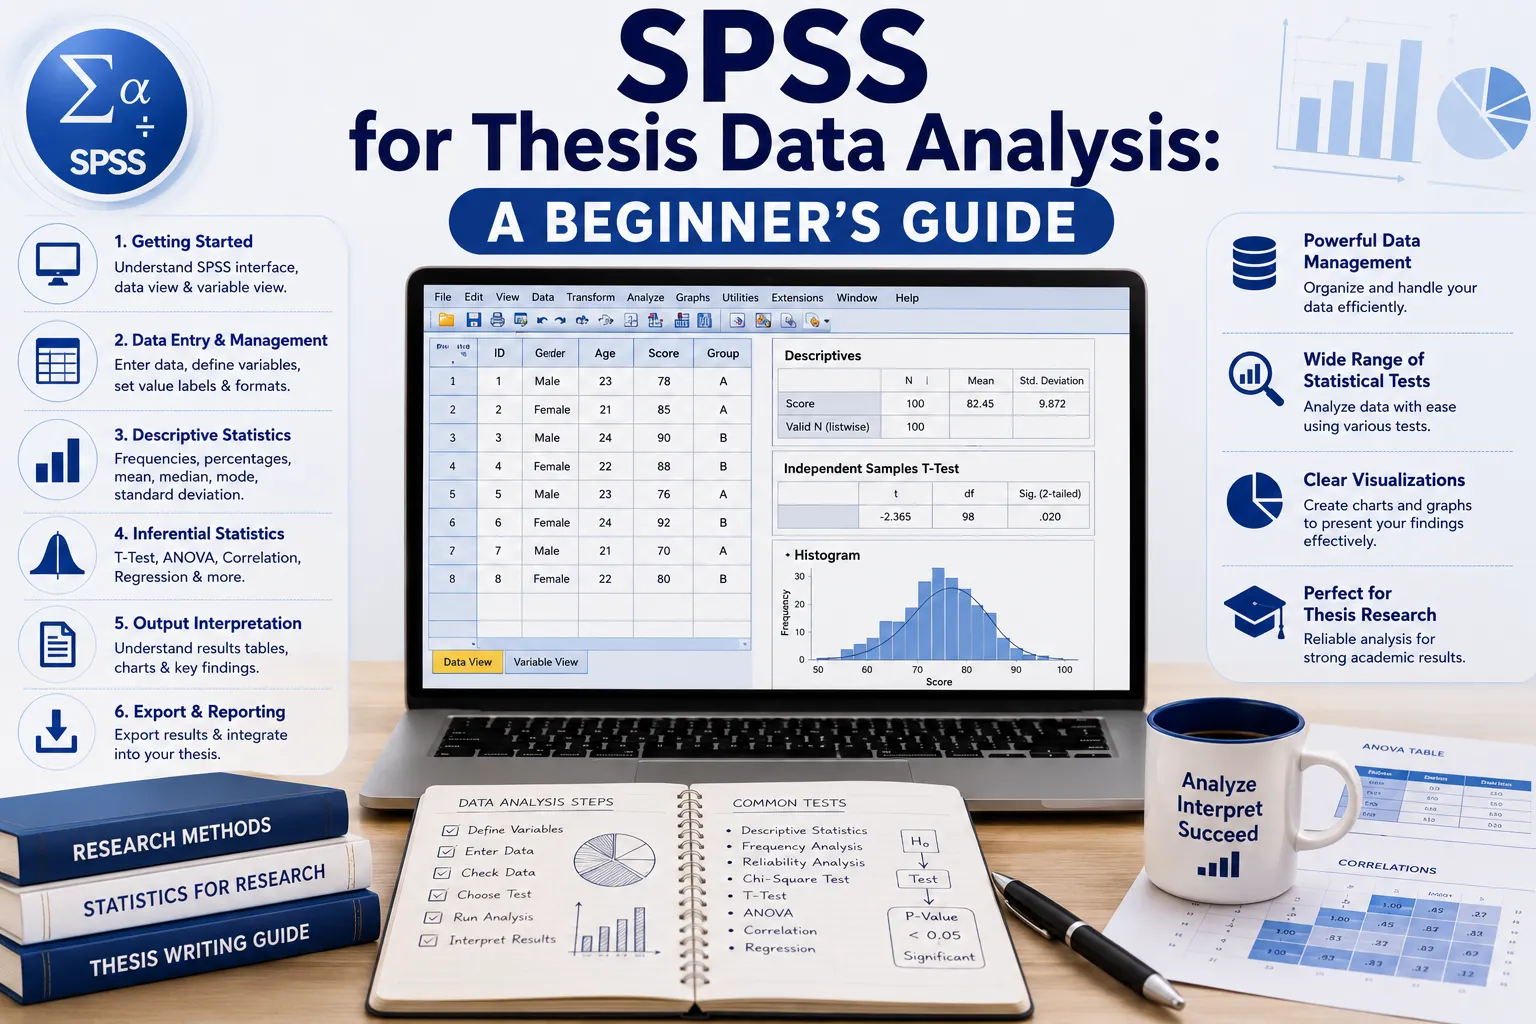
Opening SPSS for the first time with a thesis dataset in front of you can feel intimidating — rows of numbers, unfamiliar menus, and the nagging worry that one wrong click could compromise months of data collection. The good news is that SPSS workflows follow a predictable, learnable sequence once you understand the logic behind each step. This guide walks through SPSS for thesis data analysis from a genuine beginner's starting point, covering data entry, cleaning, descriptive statistics, and the foundational analyses most thesis writers actually need.
SPSS (Statistical Package for the Social Sciences) is the most widely used statistical analysis software in management, commerce, and social science thesis research, particularly across Indian universities. Key analyses commonly performed for thesis-level research include reliability analysis (Cronbach's Alpha), descriptive statistics, correlation analysis (Pearson or Spearman), multiple regression, t-tests, ANOVA, and factor analysis. This guide walks through the foundational steps that come before any of these substantive analyses can be run reliably.
Why Data Preparation Comes Before Everything Else
Data transformation is often described as the "invisible hero" of quantitative research. Before you can run descriptive statistics, a t-test, or a regression, your dataset needs to be cleaned, organized, and mathematically prepared. Raw questionnaire responses frequently contain categorical labels, negatively worded items, or missing values that simply can't be analyzed in their raw form.
This preparation stage matters more than beginners often expect: incorrect data transformation can lead to misleading statistical conclusions even when the subsequent statistical tests themselves are technically applied correctly. In other words, a technically perfect regression run on poorly prepared data will still produce untrustworthy results. Getting the preparation stage right is not a formality — it's foundational to everything that follows.
Step 1: Import and Organize Your Data
Start by importing your data into SPSS (File → Open → Data), whether it originated in Excel, Google Forms, Qualtrics, or manual entry. Once imported, organize your data so that each variable is well-formatted and consistently structured before moving further.
Step 2: Define and Configure Your Variables
Each variable in SPSS comes with default settings that beginners often overlook rather than actively configure: variable type (numeric, string, date, currency, and so on), width, number of decimal places, number of columns, and alignment. These defaults won't necessarily match your actual data — a variable representing a Likert-scale response, for example, needs to be set up differently than one representing an open text response.
At this stage, also rename unclear variable names. Datasets frequently arrive with vague labels like Q1, Q2, or V12 — renaming these to something descriptive (e.g., "JobSatisfaction_Item1") makes your later output tables and thesis write-up considerably easier to interpret, both for you and for anyone reviewing your work.
Step 3: Clean Your Data Thoroughly
This is the step beginners are most tempted to rush, and the one that most directly affects the credibility of your eventual findings. A practical, thesis-level data cleaning checklist includes:
- Handle missing values — identify where respondents skipped questions or provided incomplete responses, typically by running Frequencies or Descriptives to spot gaps, then make a deliberate, documented decision about how to handle them (exclusion, imputation, or another appropriate method for your specific analysis)
- Detect outliers — a common approach is converting values to standardized Z-scores and flagging cases with |Z| greater than 3 as potential outliers worth investigating
- Recode unclear numeric codes — datasets sometimes use placeholder values like 99 or 999 to represent missing data; these need to be explicitly recoded as missing in SPSS, not left as if they were genuine numeric responses
- Remove duplicate cases — especially common in online survey data, where a respondent may have submitted more than once
- Convert categorical responses into numeric codes — for example, coding Male as 1, Female as 2, and Prefer Not to Say as 3, so SPSS can process the variable statistically
It's considered best practice to clean your entire dataset before beginning analysis. If issues surface mid-analysis, they can still be addressed, but this should be clearly documented in your thesis rather than left unacknowledged — starting with a properly cleaned dataset ensures both consistency and credibility in your eventual results.
Step 4: Document Your Cleaning Process in Your Thesis
Once your cleaning is complete, report it transparently in your methodology or results section. A commonly used and clear way to phrase this: state that the dataset was screened for duplicate entries, missing values, and outliers, that incomplete responses were excluded, and that variables were standardised before statistical analysis was conducted. This kind of transparent reporting is exactly what allows examiners to trust the reliability of your subsequent findings.
Step 5: Run Your First Descriptive Statistics
With your data cleaned and variables properly defined, generate descriptive statistics using the path: Analyze → Descriptive Statistics → Descriptives. Select your relevant variables and choose the measures you need — typically Mean, Standard Deviation, Minimum, and Maximum. This produces a summary table of your study variables and is almost always the first substantive analytical step in a thesis-level SPSS workflow, giving you (and later, your reader) a basic sense of your data's shape before moving into more complex analysis.
Step 6: Perform Basic Data Exploration
Beyond simple descriptives, explore your data more fully using frequencies, measures of central tendency and dispersion, cross-tabulations, and basic visual plots. This exploration step serves two purposes: it helps confirm your cleaning was successful (no more unexpected extreme values or miscoded categories), and it gives you an intuitive feel for your data before you commit to specific inferential tests.
Step 7: Test Reliability for Scaled Instruments
If your data collection used a scaled instrument (such as a Likert-scale questionnaire), run a reliability analysis using Cronbach's Alpha before proceeding to substantive analysis. This confirms your instrument's internal consistency and is typically reported early in your results chapter, establishing that your measurement tool performed as expected before you move on to testing your actual hypotheses.
Step 8: Move to Your Core Statistical Analysis
Once your data is clean, explored, and (if applicable) confirmed reliable, proceed to the specific analysis your research question requires:
- Correlation analysis (Pearson for normally distributed continuous data, Spearman for non-normal or ordinal data) to test relationships between variables
- Multiple regression to test whether one or more predictors explain variance in an outcome variable
- t-tests or ANOVA to compare means across two or more groups
- Factor analysis to identify underlying structure among a set of related variables
Choose the specific test based on your research question and data type, not based on which test feels most familiar — a mismatch here is one of the most common and avoidable errors at the thesis analysis stage.
Practical Checklist: Is Your SPSS Data Ready for Analysis?
- Data imported and organized in SPSS from your original source (Excel, Qualtrics, Google Forms, or manual entry)
- Variable types, widths, and decimal settings configured to match actual data, not left at defaults
- Unclear variable names renamed for clarity
- Missing values identified and a documented decision made about how to handle them
- Outliers detected (e.g., via Z-scores) and reviewed
- Placeholder missing-data codes (99, 999, etc.) properly recoded as missing
- Duplicate cases removed
- Categorical variables converted to numeric codes
- Data cleaning process documented transparently in the methodology or results chapter
- Descriptive statistics run and reviewed before proceeding to substantive analysis
- Reliability analysis (Cronbach's Alpha) completed for any scaled instruments used
- Specific statistical test chosen based on research question and data type, not convenience
Two Practical Scenarios
Scenario 1 — Catching a Data Entry Error Through Descriptive Statistics
A scholar analyzing survey data on employee job satisfaction ran initial descriptive statistics and noticed a maximum value of 15 on a variable that should have ranged from 1 to 5 on a Likert scale. Investigating further revealed a data entry error where a respondent's answer had been mistyped. Because the scholar ran descriptives before proceeding to regression analysis, this error was caught and corrected early — avoiding a distorted result that would have been much harder to trace back to its source after running a full regression model.
Scenario 2 — Documenting Missing Data Handling Transparently
A scholar's online survey had a 12% incomplete response rate, with several respondents skipping specific sections. Rather than silently excluding these cases without explanation, the scholar documented in the methodology chapter that incomplete responses were screened and excluded prior to analysis, along with the specific percentage excluded and the criteria used. This transparency satisfied the committee's expectation that data handling decisions be clearly reported, rather than raising questions about undisclosed data manipulation.
Common Mistakes Thesis Writers Make When Using SPSS
- Skipping data cleaning and jumping straight to analysis, risking distorted results from unaddressed missing values, outliers, or miscoded variables.
- Leaving variable names as vague defaults (Q1, Q2, V12), making later output tables difficult to interpret and write up clearly.
- Failing to document the data cleaning process in the thesis, leaving examiners unable to verify how data quality issues were handled.
- Choosing a statistical test based on familiarity rather than matching it to the specific research question and data type.
- Not running basic descriptive statistics first, missing an easy opportunity to catch data entry errors before they propagate into more complex analyses.
Frequently Asked Questions
What is SPSS for thesis data analysis, and how does a beginner get started?
SPSS is a widely used statistical software for analyzing quantitative thesis data; a beginner should start by importing and organizing data, properly defining variable types, thoroughly cleaning the dataset (handling missing values, outliers, and miscoded data), then running descriptive statistics before moving to more advanced analyses like correlation, regression, or ANOVA.
Why does data cleaning matter so much before running SPSS analysis?
Incorrect or skipped data cleaning can produce misleading statistical conclusions even when the subsequent tests themselves are run correctly, meaning cleaning is foundational to trustworthy results, not an optional preliminary step.
How does SPSS data analysis affect a thesis's overall credibility?
Transparent, well-documented data cleaning and appropriately chosen statistical tests give examiners confidence that your findings are reliable — undocumented or mismatched analysis choices are among the most common reasons a thesis's data analysis chapter draws committee scrutiny.
How long does it take to complete a thesis using this approach?
Investing proper time in data cleaning and exploration before running substantive analysis often saves time overall, since it prevents the need to re-run analyses after discovering data quality issues partway through.
Is professional help available for SPSS thesis data analysis as a beginner?
Yes. ThesisLikho's PhD-qualified experts have guided 10,000+ scholars through SPSS data preparation, statistical analysis planning, and complete thesis writing assistance tailored to individual research designs.
Get Expert Guidance on Your SPSS Thesis Data Analysis
Moving from a raw dataset to a clean, analysis-ready file in SPSS takes careful attention to variable configuration, missing data handling, and outlier detection — steps that are easy to rush but that directly shape the credibility of your results. If you'd like expert input on preparing your data or selecting the right statistical tests for your thesis, ThesisLikho's PhD-qualified team offers SPSS data preparation support, statistical analysis guidance, and complete thesis writing assistance. If you need expert guidance with your data analysis, statistical test selection, or overall results chapter, you can explore our Thesis Writing Assistance service.
a]
Talk to a Thesis Expert → https://thesislikho.com/writing-services/thesis-writing