
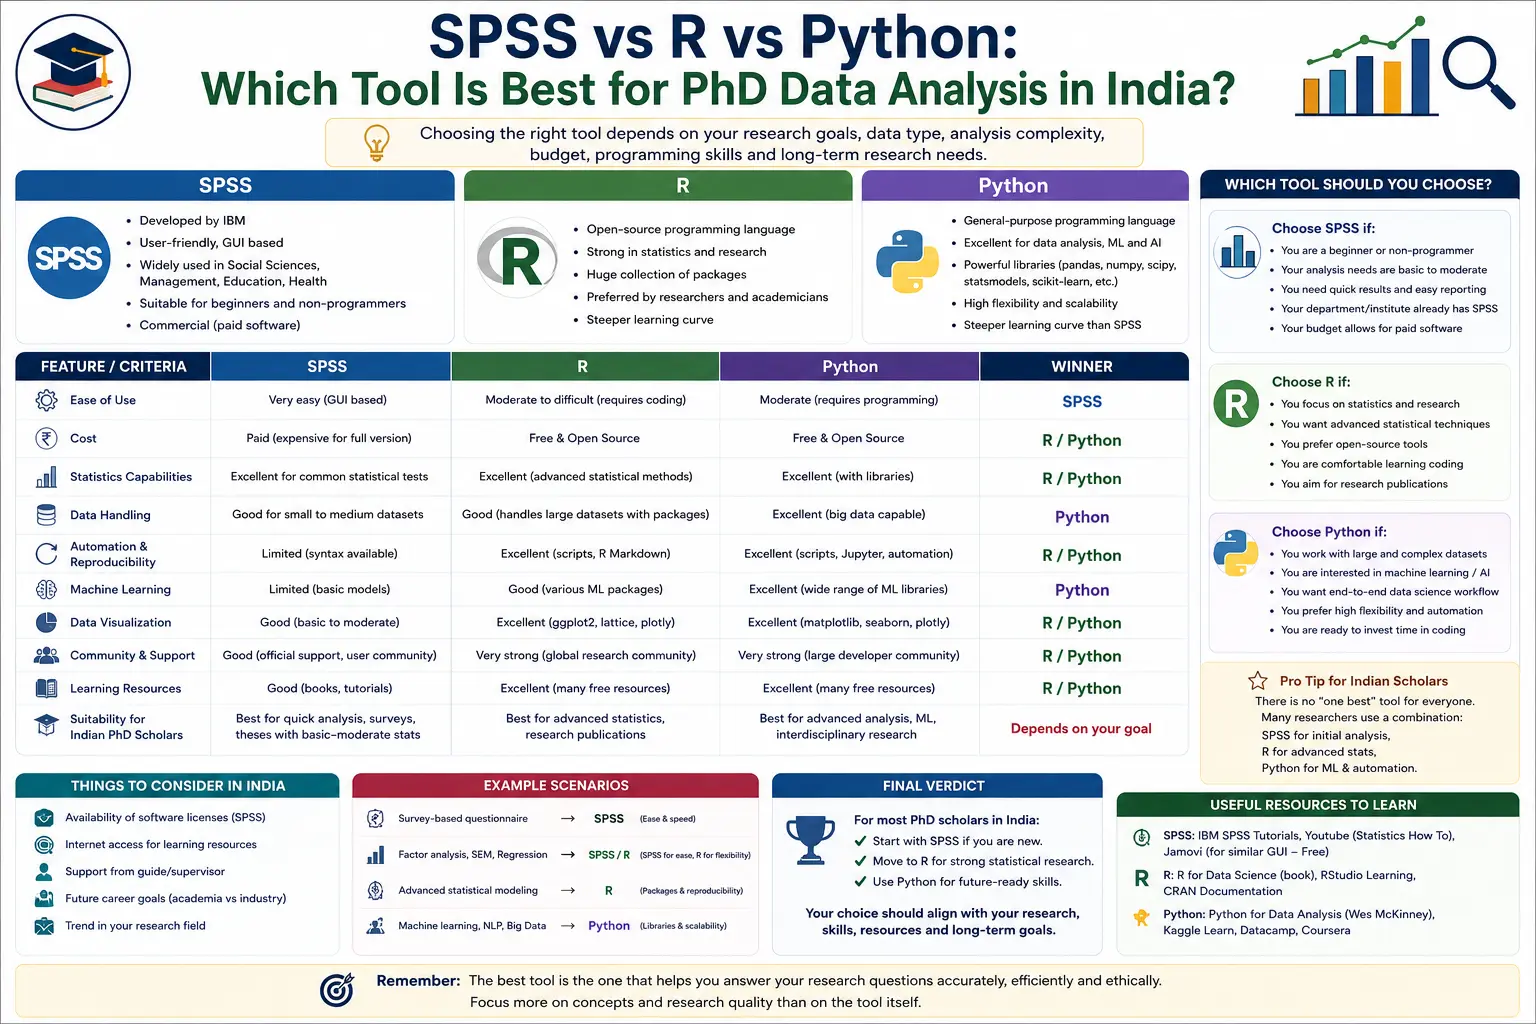
Data analysis is the backbone of modern PhD research. Whether you're conducting research in management, education, psychology, engineering, healthcare, economics, or the social sciences, selecting the right statistical software can significantly impact the quality, efficiency, and credibility of your research.
Today, researchers have access to several powerful analytical tools, but IBM SPSS Statistics, R, and Python remain the three most popular choices among PhD scholars in India. Each software has its own strengths, limitations, learning curve, and ideal use cases. While SPSS is known for its user-friendly interface, R is celebrated for its advanced statistical capabilities, and Python has emerged as the preferred language for data science, artificial intelligence (AI), and machine learning.
A common question among doctoral researchers is: Which software should I learn for my PhD? The answer depends on your research discipline, statistical requirements, programming experience, budget, and long-term career goals.
In this comprehensive guide, we'll compare SPSS, R, and Python across key factors such as ease of use, statistical capabilities, visualization, cost, research applications, and career opportunities to help you make an informed decision.
Why Choosing the Right Data Analysis Tool Matters
The software you choose influences how efficiently you can:
- Clean and organize datasets.
- Perform statistical analysis.
- Create graphs and visualizations.
- Test research hypotheses.
- Handle large datasets.
- Reproduce research findings.
- Publish research in high-quality journals.
Selecting software that aligns with your research objectives can save considerable time and improve the overall quality of your thesis.
What Is SPSS?
IBM SPSS Statistics is one of the world's most widely used statistical software packages for quantitative research. It provides a graphical user interface (GUI) that allows researchers to perform statistical analyses without extensive programming knowledge.
SPSS is particularly popular in:
- Management
- Education
- Psychology
- Healthcare
- Nursing
- Social Sciences
- Marketing
- Public Administration
Most Indian universities introduce SPSS in research methodology courses because it is relatively easy for beginners to learn.
Key Features of SPSS
SPSS offers a broad range of statistical tools, including:
- Data entry and management
- Descriptive statistics
- Reliability analysis
- Correlation
- Regression analysis
- t-tests
- ANOVA
- Chi-square tests
- Factor analysis
- Cluster analysis
- Time series analysis
- Basic data visualization
It also integrates with specialized tools such as AMOS for Structural Equation Modeling (SEM).
Advantages of SPSS
SPSS remains a preferred choice because it offers:
Beginner-Friendly Interface
Researchers can perform most analyses using menus and dialog boxes without writing code.
Fast Statistical Analysis
Common statistical procedures can be completed within minutes.
Wide Academic Acceptance
Many universities and peer-reviewed journals recognize SPSS outputs and reporting formats.
Excellent Documentation
SPSS includes detailed help files and is supported by numerous textbooks, tutorials, and online resources.
Limitations of SPSS
Despite its popularity, SPSS has some drawbacks:
- Commercial software with licensing costs.
- Limited flexibility for highly customized analyses.
- Less suitable for advanced machine learning.
- Smaller community for cutting-edge statistical development compared with R and Python.
What Is R?
R is a free, open-source programming language and statistical computing environment designed specifically for data analysis, visualization, and statistical modeling.
It has become one of the most widely used tools in academic research because of its extensive statistical capabilities and large ecosystem of contributed packages.
R is especially popular among researchers in:
- Statistics
- Economics
- Biostatistics
- Environmental Sciences
- Data Science
- Epidemiology
- Psychology
- Social Sciences
Key Features of R
R provides powerful capabilities for:
- Advanced statistical analysis
- Regression modeling
- Time series analysis
- Bayesian statistics
- Survival analysis
- Machine learning
- Data visualization
- Big data analysis
- Reproducible research
Thousands of community-developed packages extend its functionality.
Advantages of R
Completely Free
R can be downloaded and used without licensing costs.
Outstanding Statistical Capabilities
Many new statistical techniques become available in R before they appear in commercial software.
High-Quality Data Visualization
Packages such as ggplot2 enable publication-quality graphics with extensive customization.
Strong Research Community
A global community of researchers continually develops new packages and educational resources.
Limitations of R
Researchers should also consider:
- A steeper learning curve than SPSS.
- The need to write and understand code.
- Occasional package compatibility issues.
- The importance of learning good coding practices for reproducibility.
What Is Python?
Python is a general-purpose programming language that has become a leading tool for data science, artificial intelligence, automation, and scientific computing.
Although Python was not originally created for statistics, its extensive ecosystem of libraries now makes it one of the most versatile research tools available.
Python is widely used in:
- Data Science
- Artificial Intelligence
- Machine Learning
- Engineering
- Bioinformatics
- Economics
- Finance
- Computer Science
- Digital Humanities
Its popularity continues to grow across interdisciplinary research.
Key Python Libraries for Research
Python's capabilities come from specialized libraries.
Common examples include:
- Pandas – data manipulation
- NumPy – numerical computing
- SciPy – scientific computing
- Statsmodels – statistical modeling
- Scikit-learn – machine learning
- Matplotlib – plotting
- Plotly – interactive visualization
- TensorFlow – deep learning
- PyTorch – neural networks
Together, these libraries support everything from simple descriptive statistics to advanced AI research.
Advantages of Python
Versatile
Python combines statistics, programming, automation, visualization, and AI within a single ecosystem.
Excellent for Large Datasets
Python efficiently processes datasets that would be difficult to manage in many traditional statistical packages.
Automation
Researchers can automate repetitive tasks such as data cleaning, report generation, and web data collection.
Strong Career Value
Python skills are highly sought after in academia, industry, government, and research organizations.
Limitations of Python
Python also presents challenges:
- Requires programming knowledge.
- Multiple libraries can create a learning curve.
- Some advanced statistical procedures may require more coding than equivalent analyses in SPSS.
- Beginners may initially find statistical workflows less intuitive.
Ease of Learning
SPSS
SPSS is generally the easiest software for beginners because it uses menus instead of code.
Researchers can quickly learn:
- Data entry
- Descriptive statistics
- Hypothesis testing
- Regression
- ANOVA
Minimal programming experience is required.
R
R requires learning programming concepts.
Initially, researchers need to understand:
- Scripts
- Objects
- Functions
- Packages
Once mastered, R offers exceptional flexibility and analytical power.
Python
Python's syntax is widely regarded as readable and beginner-friendly for a programming language, but researchers must still learn coding fundamentals and relevant libraries before performing statistical analyses efficiently.
Cost Comparison
Budget is an important consideration for many PhD scholars.
SPSS
- Commercial software.
- Often available through university licenses.
- Individual licenses can be expensive.
R
- Completely free.
- Open-source.
- No licensing restrictions.
Python
- Completely free.
- Open-source.
- Supported by a large ecosystem of free libraries.
If cost is a major concern, R and Python are attractive options.
Which Tool Is Better for Statistical Analysis?
SPSS
Excellent for standard statistical procedures commonly used in PhD research, including:
- Regression
- Correlation
- ANOVA
- t-tests
- Chi-square tests
- Reliability analysis
R
Offers one of the most comprehensive collections of statistical methods available, making it especially suitable for advanced research and methodological innovation.
Python
Provides strong statistical capabilities through dedicated libraries while also supporting broader data science workflows.
Which Tool Is Better for Data Visualization?
Visualization helps communicate research findings effectively.
SPSS
Produces useful standard charts but offers relatively limited customization.
R
Known for publication-quality graphics with extensive flexibility.
Python
Supports both static and interactive visualizations, making it suitable for academic research as well as dashboards and exploratory analysis.
Which Tool Is Better for Machine Learning?
If your research involves predictive analytics or artificial intelligence:
- SPSS provides limited machine learning functionality.
- R supports many machine learning algorithms.
- Python is generally considered the leading ecosystem for AI and machine learning research.
Which Tool Is Better for Different PhD Disciplines?
Management
Recommended:
- SPSS
- R
- Python (for advanced analytics)
Education
Recommended:
- SPSS
- R
Psychology
Recommended:
- SPSS
- R
Healthcare
Recommended:
- SPSS
- R
- Python (for medical AI and predictive modeling)
Engineering
Recommended:
- Python
- R
Computer Science
Recommended:
- Python
Economics
Recommended:
- R
- Python
Choose the software that aligns with the methods commonly used in your discipline.
Career Opportunities
Learning analytical software provides long-term career benefits.
SPSS
Useful for:
- Academic research
- Government projects
- Healthcare organizations
- Market research
R
Valuable in:
- Universities
- Research institutes
- Pharmaceutical companies
- Statistical consulting
Python
Highly sought after in:
- Artificial intelligence
- Data science
- Finance
- Technology companies
- Engineering
- Research laboratories
Python generally offers the broadest career opportunities beyond academia.
When Should You Choose SPSS?
SPSS is an excellent choice if you:
- Are new to statistics.
- Prefer graphical interfaces over programming.
- Need standard statistical analyses.
- Work in management, education, psychology, or healthcare.
- Have access to a university license.
It is particularly suitable for coursework, dissertations, and quantitative theses using conventional statistical methods.
When Should You Choose R?
R is ideal if you:
- Want advanced statistical capabilities.
- Need highly customizable visualizations.
- Prefer open-source software.
- Conduct methodological or statistical research.
- Value reproducible research workflows.
R is especially beneficial for researchers planning academic careers.
When Should You Choose Python?
Python is a strong choice if you:
- Want to combine statistics with programming.
- Work with large or complex datasets.
- Plan to use machine learning or artificial intelligence.
- Need to automate research tasks.
- Are interested in careers in data science or analytics.
Its versatility makes it increasingly valuable across disciplines.
Common Mistakes When Choosing Statistical Software
Many PhD scholars make avoidable decisions.
Examples include:
- Choosing software based solely on popularity.
- Ignoring disciplinary norms.
- Learning multiple tools simultaneously without mastering one.
- Assuming advanced software automatically improves research quality.
- Selecting a platform that supervisors or collaborators cannot support.
Focus first on your research questions and analytical requirements.
Best Practices for PhD Scholars
To make the most of your chosen software:
- Learn the fundamentals of statistics before learning the software.
- Choose the tool that aligns with your research methodology.
- Practice with real datasets.
- Maintain well-documented and reproducible workflows.
- Back up your data and analysis files regularly.
- Stay updated with new features and packages.
- Invest time in learning data visualization and reporting.
Developing strong analytical skills is more important than mastering a specific application.
Frequently Asked Questions (FAQs)
Which software is easiest for beginners?
SPSS is generally considered the easiest because it uses a graphical interface and requires little or no programming.
Is R better than SPSS?
Neither is universally better. R offers greater flexibility, advanced statistical methods, and is free, while SPSS is easier to learn and widely used for standard quantitative analyses.
Should PhD scholars learn Python?
If your research involves machine learning, automation, large datasets, or you want broader career opportunities in data science, learning Python can be highly beneficial.
Can I use more than one software in my PhD?
Yes. Many researchers combine tools—for example, SPSS for initial statistical analysis, AMOS for Structural Equation Modeling, R for advanced visualization, or Python for data preprocessing and machine learning. Ensure your workflow is clearly documented and appropriate for your research objectives.
Which software is best for publishing research papers?
High-quality research can be published using SPSS, R, or Python. Journal acceptance depends on the rigor of the methodology, the appropriateness of the statistical analysis, and the quality of reporting—not on the software used.
Conclusion
Choosing between SPSS, R, and Python is one of the first major analytical decisions many PhD scholars face. Each tool has distinct strengths: SPSS excels in ease of use and conventional statistical analysis, R offers unmatched flexibility and advanced statistical capabilities, while Python combines statistics with programming, automation, data science, and artificial intelligence.
The best choice ultimately depends on your research discipline, methodological requirements, technical skills, available resources, and long-term career goals. If you are conducting traditional quantitative research and want a user-friendly interface, SPSS is an excellent starting point. If your work requires advanced statistical modeling and reproducible research, R is a powerful option. If you plan to work with big data, predictive analytics, or AI, Python provides exceptional versatility.
Rather than focusing on which software is "best," focus on selecting the tool that best supports your research questions and helps you produce rigorous, transparent, and meaningful results. Mastering one analytical platform thoroughly will contribute far more to the success of your PhD than trying to learn every available software package at once.
Website: www.thesislikho.com
Call / WhatsApp: +91-96438 02216