
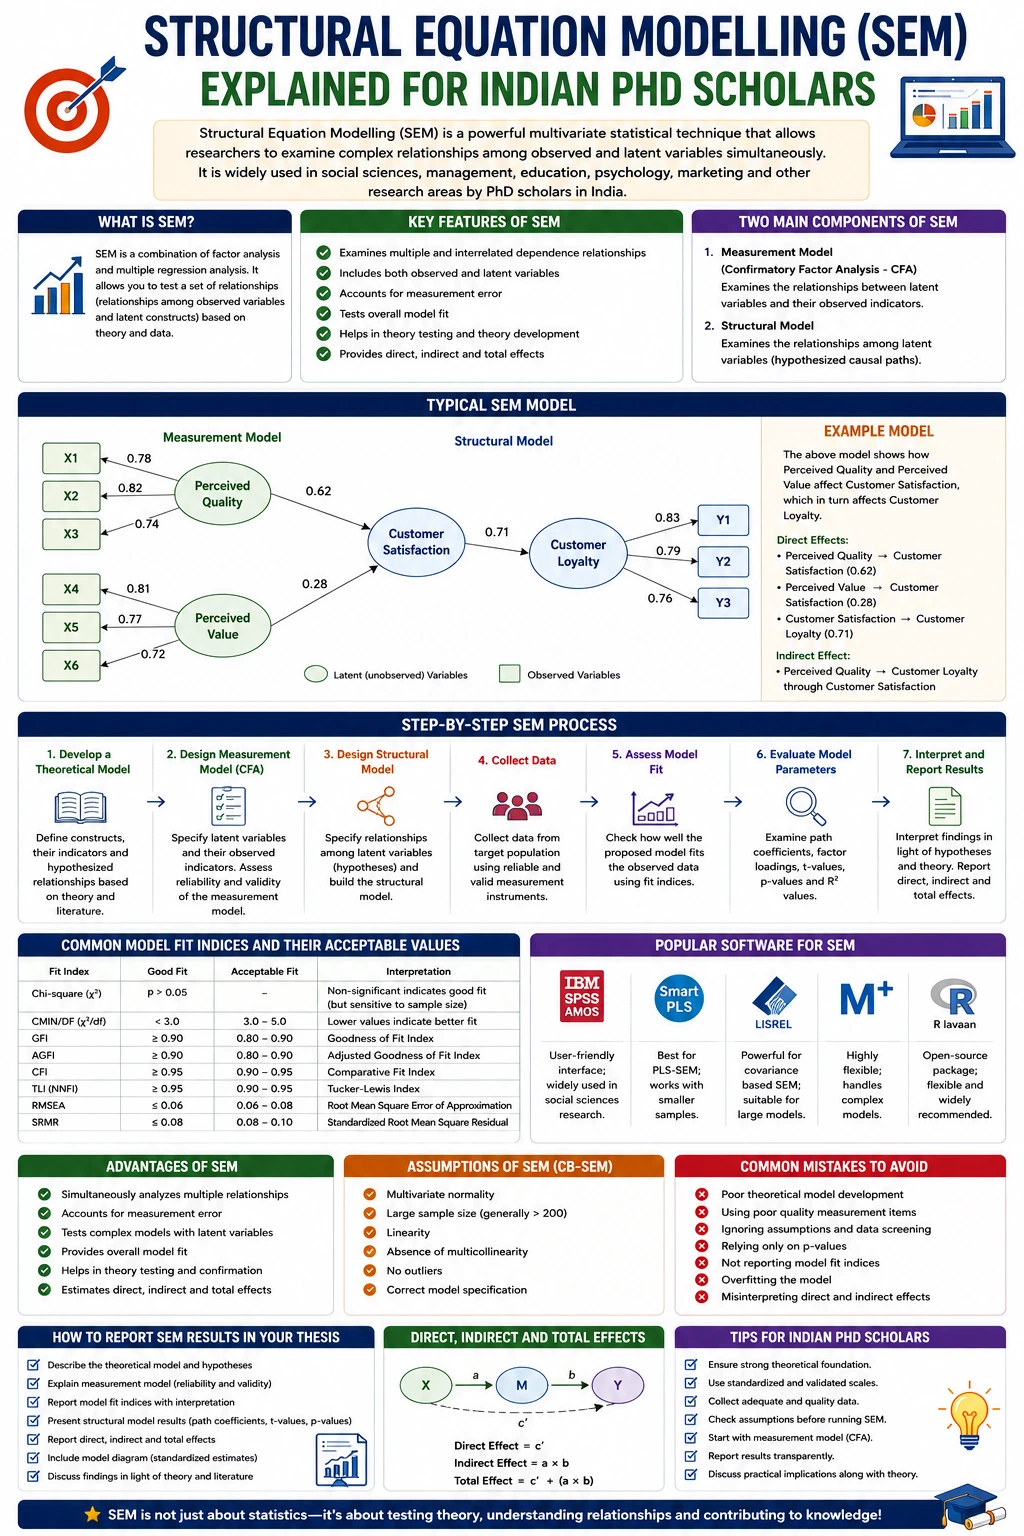
Structural Equation Modelling (SEM) is one of the most powerful statistical techniques used in modern academic research. It allows researchers to examine complex relationships among multiple variables simultaneously, making it particularly valuable for PhD scholars working in management, psychology, education, healthcare, marketing, social sciences, engineering, economics, and many other disciplines.
Unlike traditional statistical methods that analyze one relationship at a time, SEM enables researchers to test an entire theoretical framework in a single model. It combines aspects of factor analysis and multiple regression, allowing researchers to evaluate both measurement models (how well survey items measure a construct) and structural models (how constructs relate to one another). This comprehensive approach helps validate theoretical models and provides deeper insights into research questions.
Because of its ability to analyze latent variables, mediation, moderation, and complex causal pathways, SEM has become a preferred methodology for doctoral theses and high-impact journal publications. However, many Indian PhD scholars find SEM intimidating due to its mathematical complexity, specialized terminology, and software requirements.
This practical guide explains Structural Equation Modelling in simple language. You'll learn what SEM is, how it works, its components, assumptions, types, software options, model fit indices, interpretation of results, common mistakes, and best practices for using SEM in PhD research.
What Is Structural Equation Modelling (SEM)?
Structural Equation Modelling (SEM) is a multivariate statistical technique used to examine relationships between observed variables and latent constructs while simultaneously testing theoretical models.
SEM integrates two important statistical approaches:
- Factor Analysis – to assess how observed variables measure underlying constructs.
- Regression Analysis – to examine relationships among those constructs.
For example, instead of separately analyzing whether leadership influences job satisfaction and whether job satisfaction affects employee performance, SEM allows you to test the complete theoretical model in one analysis.
This ability to evaluate multiple relationships simultaneously makes SEM highly valuable for theory-driven research.
Why Is SEM Important in PhD Research?
Many research problems involve multiple variables interacting in complex ways.
Traditional techniques like regression can examine only limited relationships at a time, whereas SEM can:
- Test complete theoretical frameworks.
- Analyze direct and indirect effects.
- Evaluate latent variables measured through multiple indicators.
- Assess measurement reliability and validity.
- Estimate multiple dependent relationships simultaneously.
- Improve the accuracy of model testing.
These strengths explain why SEM is widely accepted in doctoral research and peer-reviewed journals.
Key Concepts in SEM
Before learning SEM, it is important to understand its basic terminology.
Observed Variables
Observed variables are directly measured values.
Examples include:
- Age
- Income
- Questionnaire responses
- Test scores
These are often represented as rectangles in SEM diagrams.
Latent Variables
Latent variables cannot be measured directly.
Examples include:
- Customer satisfaction
- Employee engagement
- Brand loyalty
- Academic motivation
- Organizational commitment
Researchers measure these constructs using multiple survey questions or indicators.
Latent variables are typically represented by circles or ovals in SEM diagrams.
Indicators
Indicators are the observed survey items used to measure latent variables.
Example:
Latent Variable:
Job Satisfaction
Indicators:
- I enjoy my work.
- I feel motivated at work.
- I am satisfied with my job.
- I would recommend my organization.
Together, these indicators represent the underlying construct.
Components of Structural Equation Modelling
SEM consists of two major components.
1. Measurement Model
The measurement model evaluates whether survey items accurately measure the intended latent constructs.
Researchers examine:
- Reliability
- Convergent validity
- Discriminant validity
- Factor loadings
Confirmatory Factor Analysis (CFA) is commonly used to assess the measurement model.
2. Structural Model
The structural model examines the relationships among latent variables.
For example:
Leadership → Job Satisfaction → Employee Performance
The structural model estimates:
- Direct effects
- Indirect effects
- Total effects
- Mediation
- Moderation (when appropriately specified)
Types of Structural Equation Modelling
Two major SEM approaches are commonly used in academic research.
Covariance-Based SEM (CB-SEM)
CB-SEM focuses on testing and confirming theoretical models.
It is suitable when:
- Strong theoretical foundations exist.
- Large sample sizes are available.
- Data approximately follow multivariate normality.
- The primary objective is theory confirmation.
Common CB-SEM software includes:
- AMOS
- LISREL
- EQS
- Mplus
Partial Least Squares SEM (PLS-SEM)
PLS-SEM is prediction-oriented and more flexible regarding data assumptions.
It is appropriate when:
- Research is exploratory.
- Sample sizes are relatively small.
- Data are non-normal.
- Models are complex.
- Prediction is a primary objective.
Popular PLS-SEM software includes:
- SmartPLS
- WarpPLS
- ADANCO
When Should You Use SEM?
SEM is especially useful when your research involves:
- Multiple dependent variables.
- Latent constructs measured by several indicators.
- Mediation analysis.
- Complex theoretical frameworks.
- Simultaneous testing of multiple hypotheses.
- Confirmatory theory testing.
Example research topics include:
- Customer satisfaction and loyalty.
- Employee engagement and organizational performance.
- Technology acceptance.
- Consumer purchasing behavior.
- Student academic motivation.
- Healthcare service quality.
Steps in Conducting SEM
A systematic approach improves the quality of SEM analysis.
Step 1: Develop a Theoretical Framework
Begin by reviewing the literature and identifying relationships among variables.
Develop hypotheses based on established theories.
Example:
H1: Leadership positively influences job satisfaction.
H2: Job satisfaction positively influences employee performance.
H3: Job satisfaction mediates the relationship between leadership and performance.
A clear conceptual model provides the foundation for SEM.
Step 2: Design the Measurement Instrument
Develop reliable survey items for each latent construct.
Whenever possible:
- Adapt validated scales from previous studies.
- Use consistent Likert-scale response formats.
- Pilot test the questionnaire.
High-quality measurement is essential because SEM relies on latent constructs.
Step 3: Collect Data
Gather data from an appropriate sample.
Sample size depends on:
- Model complexity.
- Number of indicators.
- Estimation method.
- Desired statistical power.
Although rules of thumb exist, conducting a power analysis is generally recommended.
Step 4: Screen the Data
Before analysis, check for:
- Missing values.
- Outliers.
- Data entry errors.
- Normality (particularly for CB-SEM).
- Multicollinearity where relevant.
Proper data screening improves model estimation.
Step 5: Assess the Measurement Model
Evaluate the quality of the measurement model before interpreting structural relationships.
Common assessments include:
Reliability
Internal consistency is commonly assessed using:
- Cronbach's Alpha
- Composite Reliability (CR)
Values around 0.70 or higher are often considered acceptable, depending on context.
Convergent Validity
Convergent validity examines whether indicators of the same construct are strongly related.
Researchers typically evaluate:
- Standardized factor loadings.
- Average Variance Extracted (AVE).
Discriminant Validity
Discriminant validity ensures that different constructs measure distinct concepts.
Common assessment methods include:
- Fornell–Larcker criterion.
- Heterotrait–Monotrait (HTMT) ratio.
Step 6: Evaluate the Structural Model
Once the measurement model is satisfactory, assess the hypothesized relationships.
Researchers examine:
- Path coefficients.
- Statistical significance.
- Confidence intervals.
- Coefficient of determination (R²).
- Effect sizes where appropriate.
- Predictive relevance (particularly in PLS-SEM).
Interpret these results in relation to your hypotheses.
Understanding Model Fit Indices
For covariance-based SEM, model fit indices help determine how well the proposed model matches the observed data.
Commonly reported indices include:
Chi-Square Test
Assesses the discrepancy between observed and model-implied covariance matrices.
Because it is sensitive to sample size, researchers rarely rely on it alone.
Comparative Fit Index (CFI)
Higher values generally indicate better model fit.
Tucker–Lewis Index (TLI)
Evaluates model fit while considering model complexity.
Root Mean Square Error of Approximation (RMSEA)
Lower values generally indicate better approximate fit.
Standardized Root Mean Square Residual (SRMR)
Represents the average standardized residual difference between observed and predicted relationships.
Interpret fit indices collectively rather than relying on a single statistic.
Mediation Analysis in SEM
Mediation occurs when one variable explains the relationship between two others.
Example:
Leadership → Job Satisfaction → Employee Performance
Here, job satisfaction serves as the mediator.
SEM is particularly effective for testing mediation because it estimates direct and indirect effects simultaneously.
Moderation Analysis in SEM
Moderation examines whether the strength or direction of a relationship changes depending on another variable.
Example:
The effect of leadership on job satisfaction may differ according to employee experience.
Interaction terms or specialized modeling procedures can be used to assess moderation, depending on the SEM approach.
Software Used for SEM
Several software packages support SEM.
AMOS
Widely used for covariance-based SEM due to its graphical interface.
Suitable for:
- CFA
- Path analysis
- Mediation
- Theory testing
SmartPLS
Popular for PLS-SEM.
Useful for:
- Exploratory research.
- Prediction-oriented models.
- Complex structural models.
- Smaller sample sizes.
Mplus
Supports advanced analyses including:
- Multilevel SEM.
- Latent growth models.
- Mixture modeling.
LISREL
One of the earliest SEM software packages, widely respected for confirmatory modeling.
R (lavaan Package)
An open-source alternative that provides powerful SEM capabilities for researchers comfortable with programming.
Advantages of SEM
SEM offers numerous advantages for doctoral research.
Simultaneous Analysis
Multiple relationships can be examined within a single model.
Latent Variable Analysis
SEM measures theoretical constructs that cannot be observed directly.
Measurement Error
Unlike many traditional techniques, SEM explicitly accounts for measurement error.
Theory Testing
SEM is particularly well suited for validating conceptual frameworks and theoretical models.
Mediation and Moderation
Complex causal mechanisms can be analyzed efficiently.
Limitations of SEM
Despite its strengths, SEM also has limitations.
Researchers should consider:
- The need for a solid theoretical foundation.
- Greater methodological complexity.
- Larger sample requirements for many CB-SEM applications.
- Sensitivity to poor-quality measurement instruments.
- The importance of appropriate model specification.
SEM should be chosen because it fits the research question—not simply because it is an advanced statistical technique.
Common Mistakes in SEM
Many beginners make avoidable errors.
Examples include:
- Using SEM without a theoretical basis.
- Ignoring measurement model assessment.
- Interpreting structural paths before validating constructs.
- Reporting only p-values while neglecting effect sizes and model fit.
- Using inadequate sample sizes without justification.
- Modifying models excessively to improve fit without theoretical support.
Careful planning and adherence to methodological principles help avoid these issues.
Best Practices for Using SEM
To conduct high-quality SEM research:
- Develop a strong conceptual framework from the literature.
- Use validated measurement scales whenever possible.
- Pilot test your questionnaire.
- Screen data carefully before analysis.
- Evaluate the measurement model before the structural model.
- Report reliability, validity, and structural results transparently.
- Interpret findings within the context of your theoretical framework.
- Follow the reporting guidelines recommended by your discipline and target journals.
Frequently Asked Questions (FAQs)
Is SEM difficult to learn?
SEM has a learning curve because it combines measurement theory and multivariate analysis. However, with a solid understanding of regression, factor analysis, and research methodology, most PhD scholars can learn it through practice and appropriate guidance.
What is the difference between regression and SEM?
Regression typically analyzes one dependent relationship at a time. SEM can evaluate multiple relationships simultaneously, incorporates latent variables, and accounts for measurement error.
Which software is best for SEM?
The choice depends on your objectives. AMOS is widely used for covariance-based SEM, SmartPLS is popular for prediction-oriented PLS-SEM, Mplus offers advanced modeling capabilities, and the lavaan package in R provides a powerful open-source option.
Can SEM be used with small sample sizes?
PLS-SEM is generally more suitable for smaller samples than CB-SEM. However, sample adequacy depends on model complexity, expected effect sizes, and the chosen estimation method. Researchers should justify their sample size using methodological guidance or power analysis.
Is SEM suitable for all PhD research?
No. SEM is appropriate when research involves latent constructs, multiple interrelated hypotheses, mediation, moderation, or complex theoretical models. Simpler research questions may be better addressed using techniques such as regression, ANOVA, or correlation analysis.
Conclusion
Structural Equation Modelling is one of the most sophisticated and valuable statistical techniques available to PhD researchers. By integrating measurement models and structural relationships into a single analytical framework, SEM enables scholars to test complex theories, evaluate latent constructs, and examine direct and indirect relationships with greater precision than many traditional statistical methods.
Although SEM requires careful planning, a strong theoretical foundation, reliable measurement instruments, and appropriate software, its ability to validate conceptual models makes it especially valuable for doctoral research and high-quality academic publications. Whether you choose covariance-based SEM for theory confirmation or PLS-SEM for prediction-oriented and exploratory studies, success depends on selecting the approach that best aligns with your research objectives and data characteristics.
For Indian PhD scholars seeking to produce rigorous, impactful, and internationally recognized research, developing a solid understanding of SEM can significantly strengthen both the quality of their thesis and their future academic contributions.
Website: www.thesislikho.com
Call / WhatsApp: +91-96438 02216