
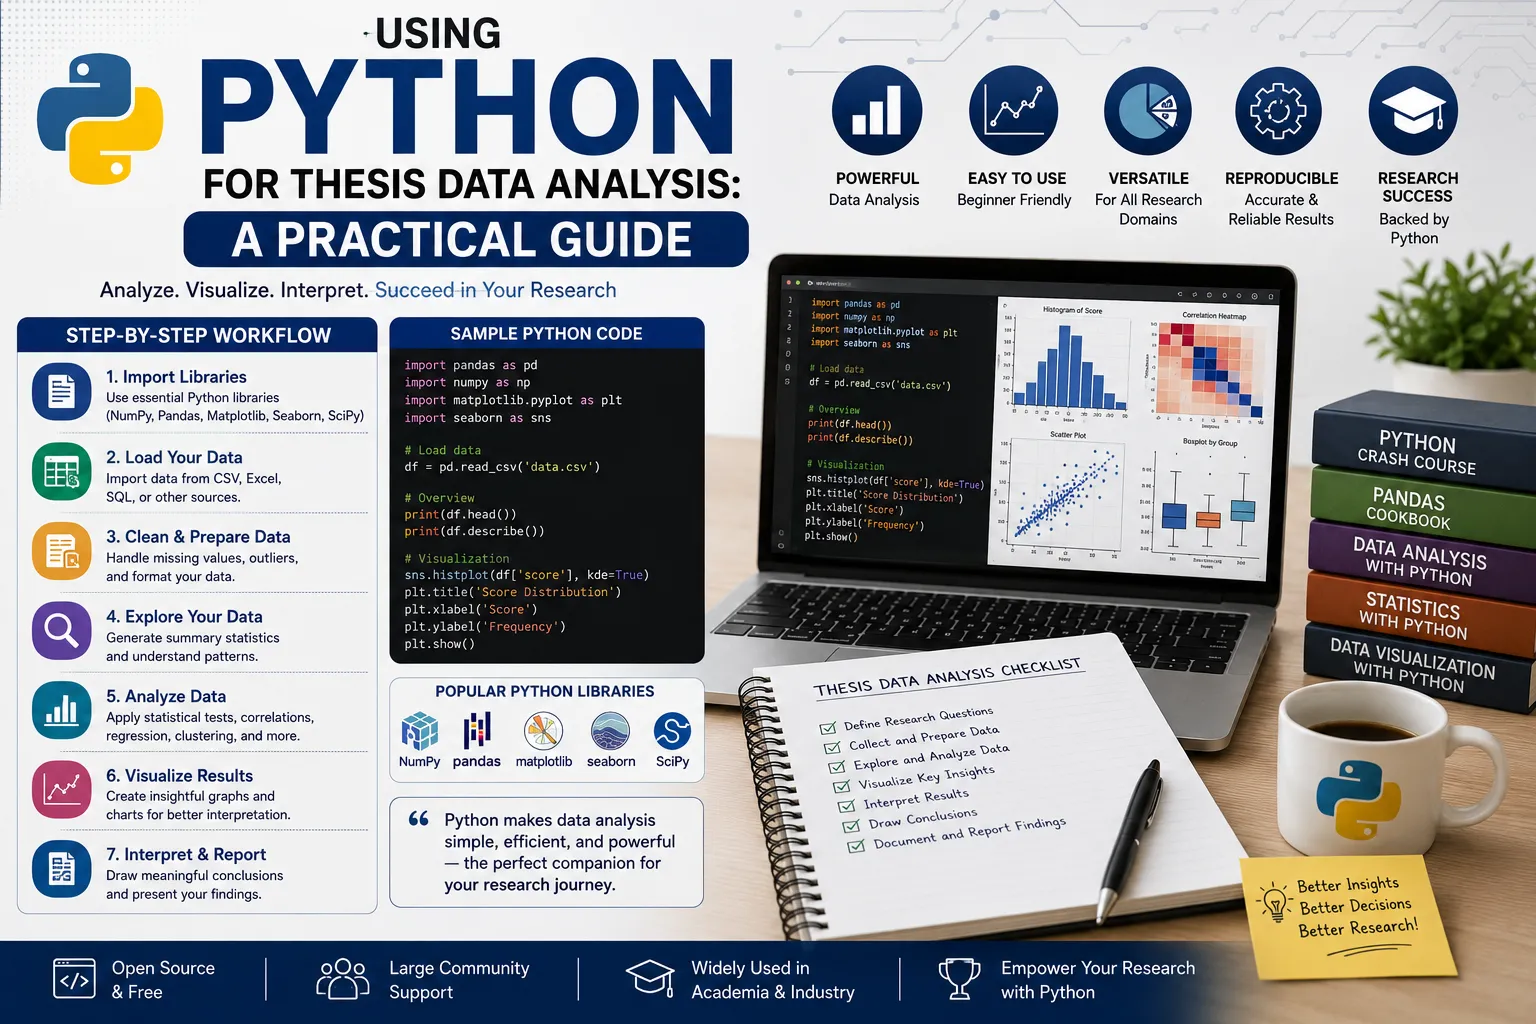
If you've been trained on SPSS but keep hearing that Python is the more flexible, more employable, more "real" way to analyze thesis data, you're facing a genuinely reasonable question with a more nuanced answer than most guides give you. Using Python for thesis data analysis is absolutely a practical guide-worthy skill — but it's not automatically the right choice for every thesis, and knowing exactly which parts of your analysis Python genuinely helps with (and which parts it doesn't replace) will save you significant wasted setup time.
This guide walks through when Python makes sense for your thesis, which specific libraries actually do what, and how to build a realistic analysis workflow — written for first-time thesis writers in India who don't necessarily have a programming background but want a clear, honest picture before committing time to learning a new tool.
Should Your Thesis Even Use Python?
Before learning any library, it's worth honestly answering whether Python is actually the right tool for your specific thesis, rather than assuming it's automatically superior because it's more commonly associated with data science. Python is a strong choice if your analysis involves larger or messier datasets that need substantial cleaning before analysis, if you want full transparency and reproducibility in exactly how each calculation was performed, if your methodology involves anything beyond standard tests SPSS handles well (custom statistical workflows, machine learning components, combining data from multiple messy sources), or if you're already reasonably comfortable with basic programming and want that skill to transfer beyond your thesis.
SPSS remains a perfectly reasonable, arguably faster choice if your dataset is moderate-sized and reasonably clean, your analysis involves standard tests (descriptive statistics, correlation, regression, ANOVA) that SPSS's menu-driven interface handles well, and you don't already have programming experience you'd be building on. Choosing Python purely because it "sounds more advanced," without a genuine analytical need for its flexibility, often costs more setup and learning time than it saves — an honest assessment worth making before you invest weeks into learning a new toolchain partway through your thesis timeline.
It's also worth considering your specific department and supervisor's familiarity with each tool. Some Indian departments and supervisors have deep, longstanding familiarity with SPSS output and expect to see it in a particular, recognizable format during review; others, particularly in newer or more technically-oriented programs, are increasingly comfortable with — or even actively encourage — Python-based analysis. Neither preference is inherently better, but discussing this directly with your supervisor before committing to either tool can save you from a mismatch discovered only after you've already built your entire analysis around one approach.
The Core Python Libraries, and What Each One Actually Does
This is where a lot of confusion happens for first-time users, since Python's data analysis ecosystem is genuinely made up of several distinct libraries, each good at a different specific job, rather than one all-purpose tool like SPSS.
Pandas is fundamentally your data organization tool. It holds your dataset in structured, spreadsheet-like tables and handles cleaning, filtering, reshaping, and combining data — but it doesn't itself run statistical significance tests. Think of it as your data's home base, not your statistics engine.
NumPy provides the underlying numerical computation engine that most other libraries, including Pandas, are built on top of. You'll rarely use it directly for thesis-level statistics, but it's working quietly underneath nearly everything else.
SciPy's stats module is the fastest path to a quick, standard hypothesis test — a t-test or a correlation coefficient with its p-value, delivered efficiently but with fairly minimal additional output beyond the core statistic.
Statsmodels is the more comprehensive, "professional-grade" option once your analysis goes beyond a simple two-group comparison — multiple regression, ANOVA designs, time series analysis. It produces full, detailed statistical output similar to what a thesis results chapter is expected to report, including coefficients, standard errors, confidence intervals, and model diagnostics together.
Pingouin is a genuinely useful, comparatively newer library worth knowing about specifically as a thesis writer, since a single function call typically returns not just a p-value but effect size, statistical power, and confidence intervals together — exactly the fuller statistical reporting a thesis methodology and results chapter is expected to include, rather than a bare p-value that needs to be supplemented with separate effect-size calculations.
Scikit-learn is oriented toward machine learning and predictive modeling rather than classical hypothesis testing — relevant if your specific methodology genuinely calls for a predictive model, but not the right tool if you're simply testing standard hypotheses.
Matplotlib and Seaborn handle visualization, with Seaborn offering a higher-level, more polished interface built on top of Matplotlib that's often better suited to producing publication- or thesis-ready charts without extensive manual formatting.
Setting Up Your Python Environment for Thesis Work
For thesis work specifically, installing the Anaconda distribution is the most common, beginner-friendly starting point, since it bundles Python itself along with Pandas, NumPy, SciPy, Statsmodels, Matplotlib, and Seaborn already installed, avoiding a separate installation process for each library individually. Jupyter Notebook, included with Anaconda, is the standard working environment for thesis-style analysis, since it lets you write and run code in small, clearly labeled sections alongside your own notes and interpretations — genuinely useful when you'll need to revisit and document your exact analytical process for your methodology chapter later. Pingouin typically needs to be installed separately using a simple package-manager command, since it isn't bundled by default in most standard distributions.
Step 1: Cleaning and Organizing Your Data With Pandas
Before any statistical test, your data needs to be loaded, checked, and cleaned — and this is squarely Pandas' job. This typically involves loading your raw data file (commonly a CSV or Excel export from your survey tool) into a Pandas structure, checking for missing values and deciding explicitly how you'll handle them, checking for and addressing outliers, and verifying your variables are coded consistently — particularly important for reverse-coded survey items, which need to be recoded before any analysis proceeds. Documenting these cleaning decisions as you go, directly in your Jupyter Notebook alongside the code that made them, gives you a ready-made, precise record for your methodology chapter's data preparation section.
Step 2: Choosing the Right Library for Your Statistical Test
Once your data is clean, the library you reach for depends on what you're actually testing. For a quick, standard test — a simple t-test comparing two groups, or a basic correlation — SciPy's stats module is often the fastest, most direct path. For anything more complex — multiple regression with several predictors, ANOVA designs, or time-series analysis — Statsmodels is the stronger choice, since its output is substantially more complete and closer to what a thesis results chapter needs to report in full. If your thesis specifically needs effect sizes, statistical power, and confidence intervals reported alongside your p-values — increasingly expected in rigorous thesis reporting, not just significance alone — Pingouin is worth learning specifically because it returns all of this together in a single, thesis-friendly output rather than requiring you to calculate each piece separately across different tools.
Step 3: Running Common Thesis Statistical Tests in Python
Most thesis quantitative chapters rely on a fairly standard, predictable set of tests, and knowing which library handles each cleanly saves real time. Descriptive statistics — means, standard deviations, frequencies — are handled directly and easily within Pandas itself. Reliability testing (Cronbach's alpha for survey constructs) is available through Pingouin with a single function call. Correlation analysis is available through SciPy for a quick check or Pingouin for a fuller output including confidence intervals. Independent and paired t-tests are available through both SciPy (quick) and Pingouin (fuller output with effect size). One-way and factorial ANOVA are best handled through Statsmodels or Pingouin, both of which handle the underlying model construction cleanly. Multiple regression is a core strength of Statsmodels, producing full coefficient tables, model fit statistics, and diagnostic output in one readable summary. Chi-square tests for categorical data are available directly through SciPy.
Before running any of these tests, it's worth checking their underlying assumptions rather than jumping straight to the test itself — normality of your data distribution, homogeneity of variance across groups, and adequate sample size for your specific test all matter, and most of these checks (a Shapiro-Wilk normality test, for instance) are available through SciPy or Pingouin with the same ease as the main tests themselves. Skipping this step is a common, avoidable mistake, since running a test whose assumptions your data doesn't meet can produce results that look statistically valid but aren't genuinely trustworthy — something an attentive examiner is likely to probe during your viva.
Step 4: Visualizing Your Results
Seaborn is generally the more thesis-appropriate starting point for visualization, since its default styling tends to produce cleaner, more publication-ready charts with less manual formatting than base Matplotlib requires — though Matplotlib remains available underneath for fine-grained customization when you need it. Common thesis visualizations — bar charts comparing group means, scatter plots showing correlations, histograms showing variable distributions — are all straightforward in Seaborn with relatively concise code. Keep visuals tied directly to a specific hypothesis or research question you're addressing, rather than generating a chart simply because the library made it easy to produce one.
Can Python Handle Qualitative or Text Data?
This deserves an honest answer rather than an overselling one. Python does have genuine text-processing libraries — NLTK is the traditional, well-documented starting point, good specifically for learning and prototyping given its academic-friendly documentation and tutorials, while spaCy is a more modern, industrial-strength alternative better suited to larger-scale text processing tasks. Both can handle tokenization, basic sentiment scoring, word-frequency analysis, and other genuinely useful preprocessing steps.
Where Python is more limited is in the nuanced, interpretive thematic coding process that's actually central to most qualitative thesis research — identifying meaning, developing and refining themes from interview or focus-group data, and building the kind of rich, contextual understanding qualitative analysis requires. This interpretive process remains something a researcher does directly, typically supported by dedicated qualitative analysis software built specifically for this purpose, rather than something Python code performs on its own. A realistic, honest framing: Python is a genuinely useful supplementary tool for large-scale text preprocessing, word-frequency analysis, or basic sentiment scoring within a qualitative or mixed-method thesis, but it's not a substitute for the interpretive coding process itself.
Python Versus SPSS: An Honest Comparison
Python offers real advantages worth weighing: full transparency, since every calculation is visible in your code rather than hidden behind menu clicks, making your analysis genuinely reproducible; no licensing cost, unlike SPSS's often expensive institutional licensing; and much greater flexibility for combining, cleaning, or transforming messy or unusually structured data. SPSS offers real advantages too: a significantly gentler learning curve for scholars without programming background, faster results for standard, well-defined tests without needing to write or debug code, and widespread familiarity among supervisors and examiners in many Indian departments, which can matter practically when discussing your methodology at your viva.
Neither tool is objectively superior for every thesis — the right choice depends on your specific dataset's complexity, your existing skills, your timeline, and, often quite practically, what your department and supervisor are most familiar with and comfortable reviewing.
Reporting Python Results in APA Style
Whichever library produces your statistical output, how you report it in your thesis follows the same APA style conventions regardless of which software generated the numbers. Statistical results are reported with the specific test statistic, degrees of freedom where applicable, the p-value, and — increasingly expected — the effect size, formatted according to APA's specific conventions for each test type. This is exactly where Pingouin's combined output (statistic, p-value, effect size, and confidence interval together) genuinely saves reporting time, since you're not hunting across multiple separate outputs to assemble a single APA-formatted results sentence. Whatever library you use, always double-check your reported values against APA's current formatting guidance for that specific test, since formatting conventions (italicization, decimal places, exact ordering of statistics) are precise and commonly checked closely by examiners.
A Realistic Example Workflow
A typical quantitative thesis analysis in Python might look like this: load your survey export into Pandas and clean it, checking for missing data and recoding any reverse-scored items. Run reliability testing on your survey constructs using Pingouin's Cronbach's alpha function. Run descriptive statistics directly in Pandas to summarize your sample's demographics and key variables. Run correlation analysis using Pingouin to check relationships between your key variables, including the confidence intervals your results chapter will need to report. Run your main hypothesis tests — regression, ANOVA, or t-tests depending on your specific design — using Statsmodels or Pingouin depending on complexity. Visualize your key findings using Seaborn, tied directly to specific hypotheses. Document each step's reasoning directly in your Jupyter Notebook as you go, giving you a precise, ready reference for writing your methodology chapter's data analysis section afterward.
If your thesis specifically involves survey data collection and you want a deeper walkthrough of the full survey analysis process, our sibling guide on [Link: How to Analyze Survey Data for a Thesis Chapter] covers that specific workflow in more depth. And if you want to make sure your Python-based analysis avoids common pitfalls that get results chapters flagged during review, our related guide on [Link: Common Statistical Errors That Get Thesis Chapters Rejected] is worth reading alongside this one.
Common Mistakes When Using Python for Thesis Analysis
- Choosing Python purely because it "sounds more advanced," without a genuine analytical need that justifies the additional learning time
- Using SciPy for a test that genuinely needs Statsmodels' fuller output, then having to manually calculate missing statistics (like effect size) separately afterward
- Not documenting cleaning and analysis decisions as you go, leaving you to reconstruct your exact process later when writing your methodology chapter
- Assuming Python can perform genuine interpretive qualitative thematic coding on its own, rather than using it as a supplementary preprocessing tool
- Skipping reliability and assumption checks before running a significance test, simply because Python makes it technically easy to run the test regardless
- Reporting raw Python output directly in your thesis without reformatting it to match APA's specific statistical reporting conventions
Data Analysis Workflow Checklist
Before finalizing your Python-based analysis, confirm the following:
- You've confirmed Python is genuinely the right tool for your specific dataset and analysis needs, not chosen by default
- Your data cleaning steps (missing values, outliers, reverse-coded items) are documented directly alongside your code
- You've matched each specific test to the right library — quick tests in SciPy, complex models in Statsmodels, effect-size-inclusive output in Pingouin
- Reliability and validity checks are run and reported before your main hypothesis tests
- Your visualizations are tied directly to specific hypotheses or research questions, not generated simply because they were easy to produce
- Your final reported statistics are reformatted to match APA style conventions, not left in raw Python output format
- Your full analysis code and reasoning are saved and organized well enough that you (or an examiner) could follow your exact process later
How Long Does This Take to Learn and Use?
For a scholar with no prior programming experience, building basic working comfort with Pandas and one statistical library (typically Pingouin or Statsmodels, given their more complete output) realistically takes two to four weeks of dedicated, part-time learning before you're comfortable running your actual thesis analysis. Once comfortable, running your full quantitative analysis chapter — from data cleaning through final visualization — commonly takes three to five weeks for a typical thesis dataset, somewhat longer than an equivalent SPSS-based workflow initially, though the transparency and reproducibility benefits often pay off if you need to revise your analysis later based on supervisor feedback, since your entire process is documented in reusable code rather than menu clicks that need to be manually repeated.
If you need expert guidance on choosing the right analysis approach or interpreting your Python-based results, you can explore our Thesis Writing service, where our PhD-qualified mentors help scholars build sound, well-documented data analysis workflows appropriate to their specific thesis and dataset.
FAQs
What is using python for thesis data analysis a practical guide?
It's a practical framework for deciding when Python is genuinely the right tool for your thesis, understanding which specific library (Pandas, SciPy, Statsmodels, Pingouin) handles which part of your analysis, and building a realistic, well-documented workflow from data cleaning through final results reporting.
Why does using python for thesis data analysis a practical guide matter?
Python's data analysis ecosystem is made up of several distinct libraries rather than one all-purpose tool, and using the wrong one for a given task — or choosing Python without a genuine analytical need — wastes real time. Understanding which library does what specifically prevents this common, avoidable inefficiency.
When should you use python for thesis data analysis a practical guide?
Python makes the most sense when your dataset needs substantial cleaning, when you want full analytical transparency and reproducibility, or when your methodology goes beyond what SPSS's standard menu-driven tests handle well. For simpler, cleaner datasets with standard tests, SPSS often remains the faster, more practical choice.
How long does it take to complete a thesis using this approach?
Building basic working comfort with Python's core libraries typically takes two to four weeks for a scholar without prior programming experience. Running a full quantitative analysis chapter once comfortable commonly takes three to five weeks, depending on dataset size and analysis complexity.
Is professional help available to use python for thesis data analysis a practical guide?
Yes. Many scholars work with experienced thesis mentors to choose the right Python libraries for their specific analysis, structure a well-documented workflow, and correctly report results in APA style — this is exactly the kind of support ThesisLikho's PhD-qualified mentors provide.
Talk to a Thesis Expert: If you're deciding between Python and SPSS, or want a second opinion on your data analysis workflow before you commit weeks to it, ThesisLikho's PhD-qualified mentors can help you choose the right approach. Explore our Thesis Writing Service →