
You've surveyed employees about a new system rollout, or pulled six months of helpdesk ticket data, or run usability tests on an app prototype — and now you're facing the same question every MBA IT scholar eventually hits: what do you actually do with it? Learning how to analyze data for an MBA information technology thesis means matching your analysis technique to what IT research specifically investigates — adoption, usability, security perception, project outcomes — rather than applying generic statistical methods that don't quite fit the questions IT theses typically ask.
This guide walks through the analytical techniques and frameworks that dominate MBA-level IT research: technology adoption models, usability scoring, IT project performance metrics, and how to handle both survey data and system-generated log data. We've grounded this in current 2026 IT adoption research practice and the patterns we see across MBA scholars ThesisLikho supports through the data analysis stage.
What Makes IT Thesis Data Analysis Different
MBA Information Technology dissertations sit at a specific intersection: they're grounded in established technology adoption and information systems theory, but they're evaluated within the same applied, timeline-constrained MBA framework as any other MBA specialization. This means your analysis needs to draw on IT-specific frameworks — technology acceptance constructs, usability measures, project performance metrics — rather than generic business analysis alone, while still staying appropriately scoped for a three-to-six-month dissertation timeline rather than a multi-year PhD study.
Most MBA IT theses fall into one of a few recognizable analytical patterns: measuring why users adopt or resist a specific technology, evaluating how usable or effective a system actually is, assessing IT project or implementation outcomes, or understanding perceptions of IT security and risk. Identifying which pattern your thesis fits early makes choosing the right analysis technique considerably more straightforward.
Descriptive Statistics: Your Starting Point
Regardless of which specific IT topic your thesis addresses, descriptive statistics come first: means, frequencies, and distributions that establish the basic shape of your data before any theoretical model or advanced technique is applied. For adoption research, this might mean summarizing overall usage intention scores across your sample; for usability research, average task completion rates or scores; for project performance research, average time and cost overruns across the projects you're examining.
Presenting this descriptive picture clearly before moving into more advanced analysis gives your reader — and your examiner — the context needed to evaluate whether your deeper findings make sense, and it's a step that's easy to underweight when scholars are eager to get to the "real" analysis.
The Technology Acceptance Model and How to Analyze It
The Technology Acceptance Model (TAM) is the dominant theoretical framework in IT adoption research, and a large share of MBA IT theses studying why users adopt, resist, or continue using a specific technology are built around it. TAM's core logic is straightforward: perceived usefulness (does this technology help me do my job better) and perceived ease of use (is this technology easy to work with) together shape a user's attitude toward a technology, which in turn predicts their behavioral intention to use it, and ultimately their actual usage behavior.
Analyzing TAM-based data typically follows a standard sequence: first, confirm that your survey items reliably measure their intended constructs (checking Cronbach's Alpha for each construct, with 0.70 as the conventional minimum acceptable threshold); second, test the hypothesized relationships between constructs using regression analysis for simpler models, or structural equation modelling (commonly PLS-SEM, run in software like SmartPLS) for models involving multiple mediating relationships between usefulness, ease of use, attitude, and intention. At MBA scale, a straightforward regression-based approach testing whether perceived usefulness and ease of use predict behavioral intention is usually sufficient and appropriately scoped — full PLS-SEM with multiple mediation paths is more common in PhD-level TAM research, though it remains an option if your specific model calls for it and your timeline allows.
Extending TAM: UTAUT and Related Models
If your research question involves organizational or social factors beyond individual perception — how workplace pressure, social influence, or facilitating organizational conditions affect technology adoption — the Unified Theory of Acceptance and Use of Technology (UTAUT) extends TAM's core logic with additional constructs: social influence (do colleagues and supervisors expect me to use this), facilitating conditions (does the organization provide adequate support and infrastructure), and effort expectancy (a close relative of perceived ease of use). UTAUT is particularly relevant for MBA IT theses studying enterprise or organizational technology adoption, where individual perception alone doesn't fully explain adoption patterns.
The analytical approach for UTAUT-based research mirrors TAM's: validated scale items for each construct, reliability checking, and then regression or SEM-based hypothesis testing of the relationships your model proposes. Choosing between TAM and UTAUT (or a combination) should be driven by which constructs your specific research question actually needs, not by which model sounds more sophisticated — a simpler, well-executed TAM model is stronger than an overextended UTAUT model your data and timeline can't properly support.
Measuring System Usability
If your thesis evaluates how usable a specific system, application, or platform actually is — rather than why users choose to adopt it in the first place — the System Usability Scale (SUS) is a widely used, standardized tool worth knowing well. SUS is a ten-item questionnaire producing a single usability score on a 0-to-100 scale, calculated through a specific, established scoring formula rather than a simple average, making it straightforward to apply consistently and compare against published benchmark scores from other studies.
Analyzing SUS data typically means calculating the standardized score for each respondent, then reporting the average score alongside a comparison to established usability benchmarks from the wider SUS literature — a mean score in the high 60s to low 70s is commonly considered acceptable usability, while scores well below that threshold suggest genuine usability problems worth investigating further, ideally paired with qualitative feedback (task observation notes, open-ended survey comments) explaining what specifically drove lower scores.
Analyzing IT Project Success and Performance Data
If your thesis evaluates IT project outcomes — implementation success, cost and schedule performance, post-implementation satisfaction — your analysis typically centers on comparing planned versus actual outcomes across a set of projects or a single detailed case. Common metrics include schedule variance (planned versus actual completion time), cost variance (budgeted versus actual spend), and stakeholder satisfaction scores collected through post-implementation surveys.
For a single-case or small-sample project analysis, descriptive comparison (planned versus actual, presented clearly with brief interpretation) is often entirely appropriate at MBA scale. For a study comparing outcomes across multiple projects, correlation or regression analysis can test whether specific factors (project size, team experience, methodology used) relate systematically to success or failure outcomes — though with a genuinely honest acknowledgment of how small an MBA-scale project sample typically is, and appropriately cautious language about what conclusions that sample size can support.
Analyzing Security and Risk Perception Data
IT theses studying cybersecurity awareness, risk perception, or security policy compliance typically rely on survey data measuring constructs like perceived security risk, security self-efficacy, and compliance intention — often analyzed using the same reliability-then-relationship-testing approach as TAM-based research, since these constructs are measured and analyzed similarly. Protection Motivation Theory is a commonly used theoretical framework specifically for security behavior research, examining how perceived threat severity and perceived coping efficacy together predict protective behavior intentions.
If your security-focused thesis includes actual incident or breach data rather than only perception survey data, treat this as a distinct analytical stream — incident frequency, response time, and severity data are typically summarized descriptively and, where sample size allows, compared across relevant categories (department, system type, time period) rather than folded into the same statistical model as your perception survey data.
Working With System-Generated Log and Usage Data
Some MBA IT theses have access to system-generated data — server logs, application usage analytics, helpdesk ticket records — rather than or alongside survey data. This kind of data typically requires different handling: cleaning and structuring raw log data into a usable format (often the most time-consuming part of this analysis), establishing clear time-based patterns (daily or weekly usage trends, ticket volume over time), and, where relevant, connecting these patterns back to specific events (a system update, a training rollout, an organizational change) that might explain shifts in the data.
Log and usage data can powerfully complement survey-based adoption or usability research — for example, pairing self-reported perceived usefulness scores with actual system usage frequency data lets you check whether stated attitudes and actual behavior align, a genuinely valuable finding if your thesis has access to both data types.
Qualitative Analysis for IT Adoption Research
Interviews and open-ended survey responses remain valuable in IT research, particularly for understanding why adoption, resistance, or usability problems occur in ways quantitative scores alone can't explain. Thematic analysis — coding interview transcripts or open-ended responses into recurring themes, then interpreting what those themes mean for your research question — is the standard approach, and for a typical MBA-scale qualitative component (five to fifteen interviews, or a modest set of open-ended survey responses), this can usually be done manually in a well-organized document rather than requiring dedicated qualitative software.
Pairing qualitative findings with your quantitative TAM, UTAUT, or usability results often produces the most compelling IT theses — a low usability score paired with specific interview quotes about exactly which interface elements caused confusion tells a far richer story than either the score or the quotes alone.
Choosing the Right Software Tool
Excel handles descriptive statistics, basic charts, and simple correlation or regression analysis, and remains genuinely sufficient for many MBA-scale IT theses, particularly smaller survey samples. SPSS is the standard step up for more structured statistical testing — reliability analysis, correlation, regression, ANOVA — when your analysis needs go beyond comfortable Excel use, and many business schools provide institutional access. SmartPLS is worth considering specifically if your TAM, UTAUT, or security model involves multiple mediating relationships that a simpler regression approach can't adequately capture — though confirm with your supervisor that this level of analysis fits your specific timeline and research question before committing to it. For log or usage data analysis, Excel or basic Python/R scripting (if you have the skills or access to support) can handle the data cleaning and pattern analysis most MBA-scale studies require, without needing specialized data engineering tools.
Interpreting Results Without Overclaiming
A statistically significant relationship between, say, perceived usefulness and behavioral intention tells you the relationship is unlikely to be due to chance in your sample — it doesn't automatically mean the relationship is strong, large, or that it proves causation, particularly in a cross-sectional survey design where usefulness and intention were measured at the same point in time. Reporting effect sizes alongside significance, and using careful language ("associated with" rather than "causes") unless your design specifically supports causal inference, keeps your findings chapter accurate and defensible.
This matters particularly in TAM-based research, where the underlying theoretical model implies a causal chain (usefulness and ease of use cause attitude, which causes intention) that a single cross-sectional survey can't actually establish on its own — acknowledging this as a limitation, rather than overstating what your specific data supports, is exactly the kind of methodological maturity examiners look for.
Real MBA IT Thesis Data Analysis Example
An MBA student studying employee adoption of a newly implemented enterprise resource planning system at a mid-sized Indian logistics company built her data analysis around a TAM-based survey of 140 employees, alongside six months of system login frequency data provided by the IT department. She began with descriptive statistics establishing overall perceived usefulness and ease of use scores, then ran reliability checks confirming Cronbach's Alpha above 0.75 for each construct. Regression analysis showed both perceived usefulness and ease of use significantly predicted behavioral intention to use the system, with usefulness showing the stronger relationship. Cross-referencing her survey data against the actual login frequency data revealed an interesting gap: employees who reported high perceived usefulness weren't always the most frequent actual users, a discrepancy she explored further through five follow-up interviews, which revealed that inconsistent managerial reinforcement — not individual attitude — was driving the gap between stated intention and actual behavior. This combination of TAM survey analysis, usage data, and qualitative follow-up gave her findings chapter a depth a single method alone couldn't have produced.
Common Data Analysis Mistakes in MBA IT Theses
- Using TAM or UTAUT without checking construct reliability first, running hypothesis tests before confirming the underlying scale items are actually measuring what they're supposed to.
- Overreaching into full PLS-SEM modelling when a simpler regression approach would answer the research question just as well within the available timeline.
- Treating a cross-sectional TAM survey's relationships as causal, overstating what a single-point-in-time design can actually establish.
- Ignoring available log or usage data in favor of survey data alone, missing an opportunity to check whether stated attitudes actually align with real behavior.
- Applying a security or adoption framework by name without properly operationalizing its specific constructs into your actual survey items.
- Skipping SUS's established scoring formula and using a simple average instead, which produces a score that isn't comparable to standard usability benchmarks.
- Not connecting quantitative and qualitative findings, presenting scores and interview quotes as separate sections rather than integrated evidence supporting the same conclusions.
- Failing to connect analysis results back to the specific research objectives stated in the introduction, leaving a technically sound analysis chapter feeling disconnected from the thesis's actual purpose.
Data Analysis Checklist
Before finalizing your MBA IT thesis data analysis chapter, confirm you have:
- Descriptive statistics presented before any theoretical model testing
- Construct reliability (Cronbach's Alpha or equivalent) checked before testing hypothesized relationships
- A clearly justified choice of framework (TAM, UTAUT, SUS, Protection Motivation Theory, or equivalent) matched to your specific research question
- An analysis technique (regression, correlation, or SEM) appropriately scoped for your MBA timeline and sample size
- Log or usage data incorporated where available, cross-checked against survey findings
- Qualitative data (if present) thematically analyzed and integrated with quantitative findings, not just quoted separately
- Careful, non-causal language used where your design doesn't support causal claims
- Every analytical result explicitly connected back to a specific research objective
- Limitations of your data, sample, or design honestly acknowledged
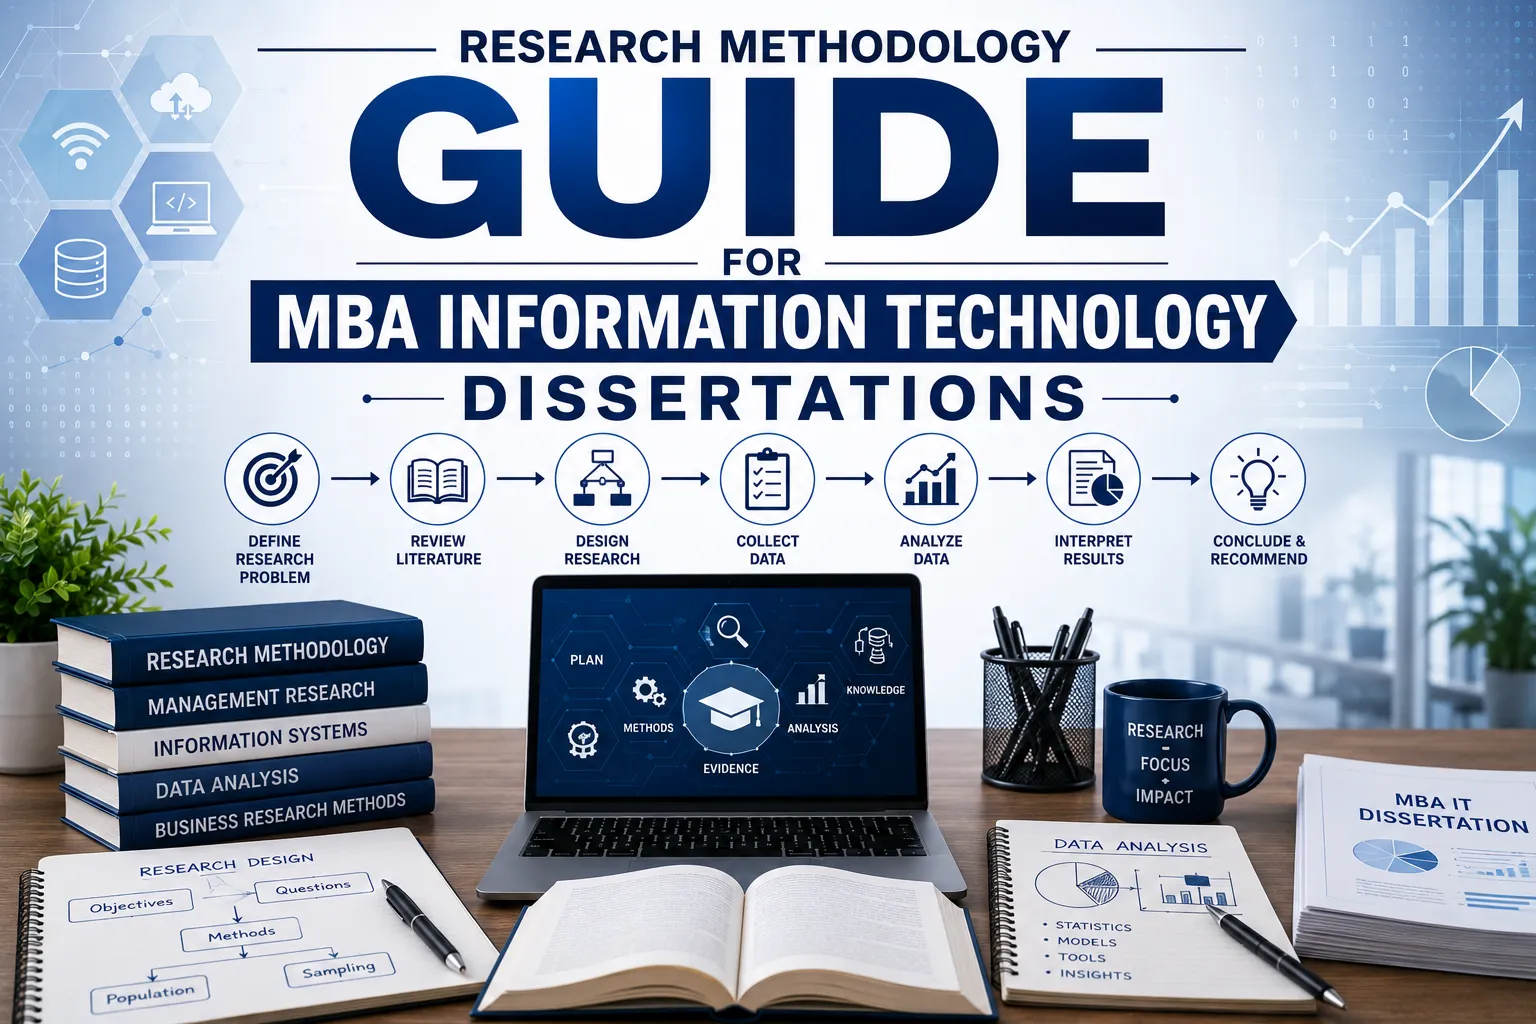
For guidance on the methodology decisions that shape this analysis stage, our related guide, research methodology guide for MBA information technology dissertations, covers the design choices determining what data you'll be working with.
How Long Does It Take to Complete an MBA Thesis Using This Approach?
Data analysis for an MBA IT thesis typically takes three to six weeks within an overall dissertation timeline of three to six months, depending on whether your analysis combines survey data, system logs, and qualitative interviews or relies on a single data type. Scholars who select their theoretical framework (TAM, UTAUT, SUS, or another) during methodology design — rather than after data collection is already complete — generally move through this stage faster, since their survey instruments are built from the start to support the specific analysis they intend to run.
Is Professional Help Available to Analyze Data for an MBA Information Technology Thesis?
Yes — many MBA students work with academic mentors or research consultancies to choose the right technology adoption or usability framework for their specific research question, run TAM or UTAUT-based analysis correctly, and connect findings clearly back to their research objectives. ThesisLikho's research experts have supported MBA scholars through exactly this stage of IT dissertations, helping ensure analysis is technically sound, appropriately scoped for an MBA timeline, and clearly interpreted for the committee — all while keeping the underlying research and conclusions entirely your own. Explore ThesisLikho's MBA thesis assistance services for one-on-one guidance.
FAQs
How do you analyze data for an MBA information technology thesis?
Start with descriptive statistics, then apply the framework matching your specific research question — the Technology Acceptance Model or UTAUT for adoption research, the System Usability Scale for usability evaluation, or project performance metrics for implementation outcomes — testing relationships through regression or SEM as appropriate, and connecting findings explicitly back to your research objectives.
How long does it take to complete an MBA thesis using this approach?
Data analysis typically takes three to six weeks within an overall MBA IT dissertation timeline of three to six months, faster for scholars who select their analytical framework during methodology design rather than after data collection.
Is professional help available to analyze data for an MBA information technology thesis?
Yes. Research consultancies and academic mentors, including ThesisLikho's experts, help MBA students apply the right technology adoption or usability framework and interpret findings clearly while preserving full research originality.
Why should I analyze data for an MBA information technology thesis carefully?
Because IT research relies on established theoretical frameworks like TAM and UTAUT that committees expect to see properly operationalized and tested — misapplying these frameworks or overclaiming causal relationships from cross-sectional data are among the most common ways otherwise solid IT theses lose credibility.
When should you analyze data for an MBA information technology thesis for a MBA thesis?
Your analytical framework should be chosen during methodology design, before your survey or data collection instrument is finalized, so that your instrument is built from the start to properly measure the specific constructs your chosen framework requires.
Related reading: Research Methodology Guide for MBA Information Technology Dissertations and Top MBA Thesis Topics in International Business for 2026.
Ready to turn your IT research data into a defensible thesis chapter?
Get Free MBA Thesis Consultation → https://thesislikho.com/writing-services/thesis-assistance-mba