
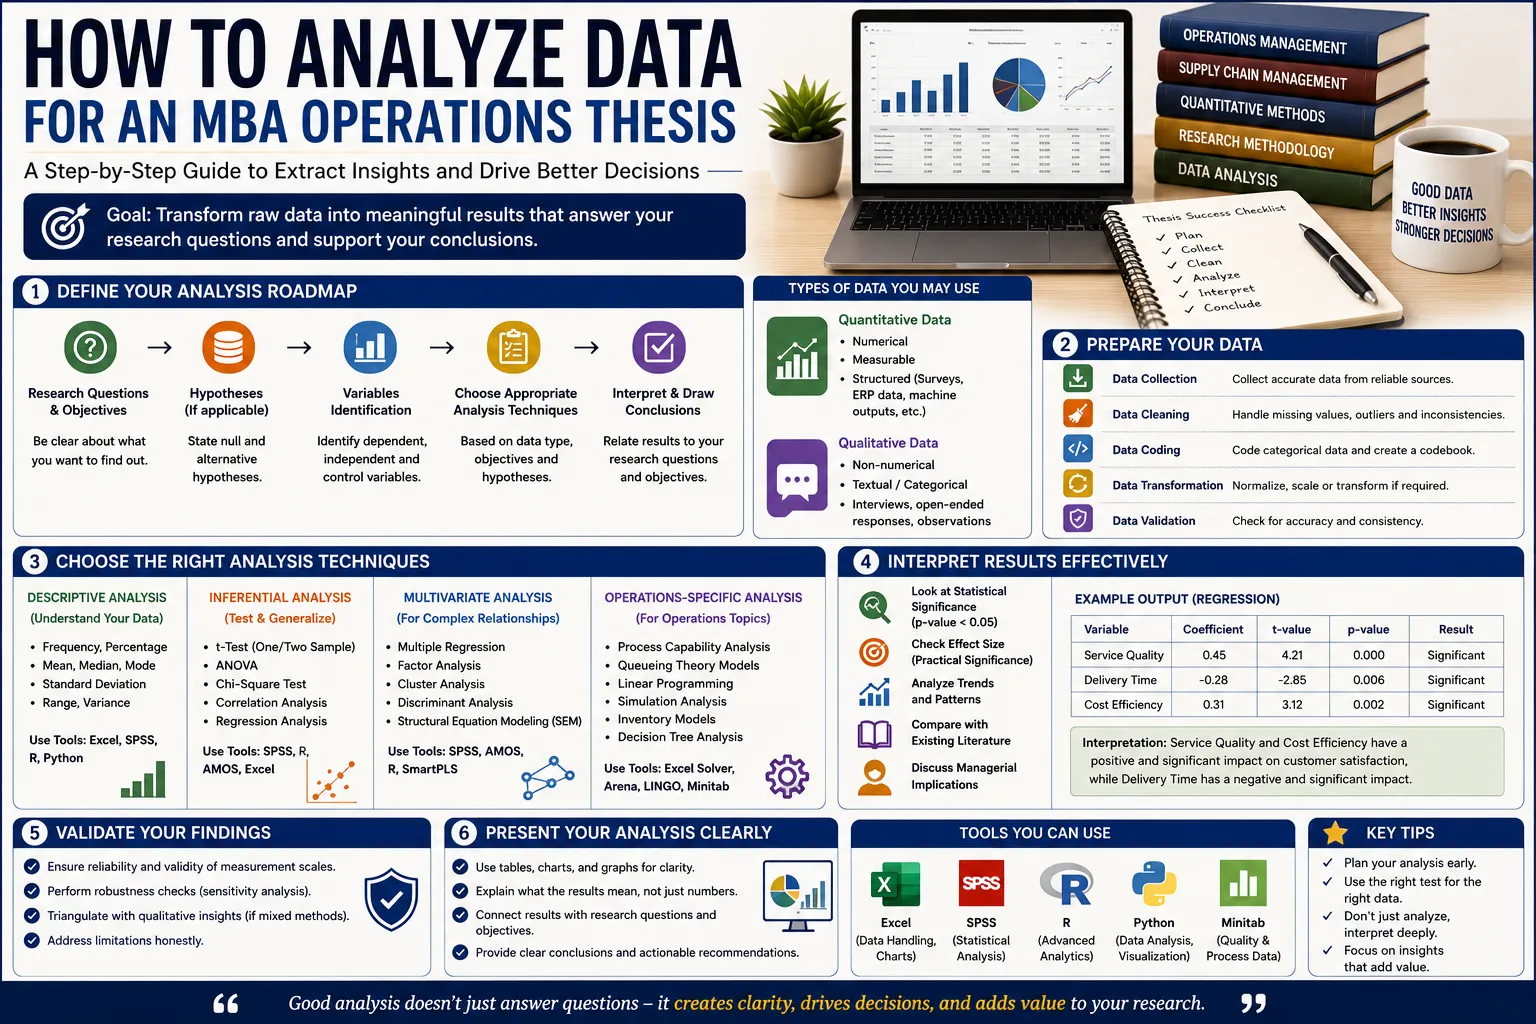
You've collected your interviews, your survey responses, or six months of a company's production data — and now you're staring at a spreadsheet wondering what to actually do with it. Learning how to analyze data for an MBA operations thesis is where a lot of otherwise solid dissertations lose momentum, not because the data is bad, but because scholars either over-complicate the analysis with techniques that don't fit an MBA timeline, or under-analyze it by presenting raw numbers without genuine interpretation.
This guide walks through exactly how to match your analysis approach to your data type, the specific tools operations scholars actually use — from basic descriptive statistics to control charts and process capability analysis — and how to move from a data table to a defensible finding your committee can trust. We've grounded this in current 2026 operations analytics practice and the patterns we see across MBA scholars ThesisLikho supports through the data analysis stage.
Matching Analysis to Your Data Type
The single biggest decision in your analysis chapter is matching your technique to your actual data, not to whatever method sounds most impressive. Quantitative data — numerical measurements like cycle time, defect rate, cost, delivery time, or survey responses on a numeric scale — calls for statistical analysis. Qualitative data — interview transcripts, observation notes, open-ended survey responses — calls for thematic or content analysis. Process data specifically tracked over time, such as daily defect counts or weekly delivery times, often calls for statistical process control techniques rather than standard descriptive statistics alone, since the goal is understanding variation and stability over time rather than a single snapshot.
Many MBA operations theses combine more than one data type — company production records alongside staff interviews, for instance — and the analysis chapter should treat each appropriately rather than forcing everything into a single statistical framework.
Descriptive Statistics: Where Every Analysis Starts
Regardless of what more advanced technique you eventually use, descriptive statistics come first: means, medians, standard deviations, frequency distributions, and basic visualizations (bar charts, histograms, line graphs) that let you and your reader understand the basic shape of your data before any deeper interpretation begins. For operations data specifically, this often means summarizing metrics like average cycle time, defect rate by product line, or inventory turnover by month, presented clearly enough that a reader can grasp the operational picture before you move into your more analytical findings.
Skipping straight to advanced statistical tests without first establishing this descriptive foundation is a common mistake — a reader (and your examiner) needs to understand what your data actually looks like before they can evaluate whether your more advanced analysis and conclusions make sense.
Inferential Statistics for Survey-Based Operations Research
If your operations thesis is built around a survey — for example, measuring how supply chain digitalization relates to perceived operational resilience across a sample of managers — you'll move from description into inferential statistics: techniques that let you test relationships and draw conclusions that go beyond your specific sample.
Common techniques at MBA level include correlation analysis to test whether two variables move together (does higher automation correlate with lower defect rates), t-tests or ANOVA to compare means across groups (do plants using Lean practices show significantly different cycle times than those that don't), and basic regression analysis to test whether one or more variables predict an outcome (does supplier lead time, inventory buffer size, and demand variability together predict stockout frequency). These techniques are typically run in SPSS or Excel, and at MBA scale, this level of analysis is usually sufficient — the more advanced structural equation modelling used in PhD-level quantitative research is rarely necessary or expected for an MBA operations dissertation.
Statistical Process Control: Control Charts and Capability Analysis
Statistical Process Control (SPC) is one of the most distinctively "operations" analytical approaches, and it's worth understanding even if your specific thesis doesn't use it directly, since many supervisors expect at least a working familiarity with it for operations topics.
Control charts plot a process metric (defect count, cycle time, output volume) over time against statistically calculated upper and lower control limits, letting you distinguish normal process variation from a genuine, significant shift that needs investigation. A process running consistently within its control limits is considered "in control"; points outside those limits, or specific non-random patterns within them, signal a process change worth investigating.
Process capability analysis goes a step further, comparing your process's actual variation against the specification limits a customer or standard requires — answering not just "is this process stable?" but "is this process actually capable of consistently meeting requirements?" This is commonly summarized through capability indices and visual tools that assess both process fit and predictability together.
If your thesis involves analyzing a company's quality or production data over time — a common operations MBA topic — control charts and capability analysis are often exactly the right tool, and dedicated software like Minitab is built specifically around making this kind of analysis accessible without requiring deep statistical programming knowledge.
Efficiency Analysis with DEA
If your research question involves comparing operational efficiency across multiple comparable units — several branches of a retail chain, several plants within a manufacturing group, or several suppliers being evaluated — Data Envelopment Analysis (DEA) is a purpose-built technique for exactly this scenario. DEA calculates a relative efficiency score for each unit based on how effectively it converts inputs (labor hours, raw material cost, capital) into outputs (units produced, revenue, service volume), identifying which units are operating on the "efficiency frontier" and by how much others fall short.
DEA is more specialized than general regression or descriptive analysis, and while it's entirely appropriate for an MBA operations thesis with a clear multi-unit comparison design, it does require either dedicated software or a solid understanding of the underlying linear programming approach — worth confirming with your supervisor early if you're considering it, to make sure the technique fits both your data and your available time.
Analyzing Qualitative Interview and Observation Data
If your operations thesis includes interviews with managers or staff, or direct process observation, the analysis approach shifts from statistics to thematic or content analysis. This typically means transcribing your interviews, coding them into recurring themes (for example, "communication breakdown between departments," "resistance to new process," "resource constraints"), and then analyzing how those themes relate to your research question and any operations framework you're applying.
For a small MBA-scale qualitative dataset — commonly five to fifteen interviews — this coding can often be done manually in a well-organized spreadsheet or document rather than requiring dedicated qualitative analysis software, though tools like NVivo or the free/lower-cost alternatives are worth considering if your qualitative dataset is larger or your university has institutional access already available. The key output of this stage isn't just a list of themes — it's an interpretation of what those themes mean for your research question, ideally connected back to whatever operations framework (Lean, SCOR, or a specific theoretical lens) your dissertation is built around.
Choosing the Right Software Tool
Excel remains genuinely sufficient for a large share of MBA operations data analysis — descriptive statistics, basic charts, simple regression, and even basic control charts through add-ins are all achievable without additional software, and Excel's near-universal availability makes it a practical default.
SPSS is the standard step up for more structured statistical testing (t-tests, ANOVA, correlation, regression) when your dataset and analysis needs go beyond what's comfortable in Excel, and many Indian business schools provide institutional SPSS access.
Minitab is the purpose-built tool for statistical process control work — control charts, process capability analysis, and Design of Experiments — and is worth using specifically if your thesis centers on process quality or stability analysis; check whether your institution provides access before considering a personal license, since the annual cost is substantial for individual use.
Excel-based SPC add-ins (such as SPC for Excel or similar tools) offer a lower-cost middle ground, bringing control chart and capability analysis capability directly into Excel for students who need SPC-specific output without a full Minitab license.
For qualitative data, a well-organized spreadsheet or document with a clear coding structure is often entirely sufficient at MBA scale, with dedicated qualitative software reserved for larger datasets or where your institution already provides free access.
Presenting Findings: Tables, Charts, and Visuals That Work
How you present your analysis matters almost as much as the analysis itself, since a committee reading dozens of dissertations will engage far more readily with clear, well-labeled visuals than with dense paragraphs of numbers. A few practical guidelines: use a bar chart or line graph rather than a table wherever a trend or comparison is the main point you're making; use a table rather than a chart when precise values matter more than the overall pattern; always label axes, units, and time periods clearly; and never present a chart or table without at least a sentence or two of interpretation immediately following it — a reader shouldn't have to guess what conclusion you want them to draw.
Every visual should earn its place by supporting a specific point in your written analysis, rather than being included simply because the data was available. A findings chapter with fifteen unexplained charts is weaker than one with five well-chosen, clearly interpreted ones.
Connecting Analysis Back to Your Research Objectives
The most common gap between a technically competent analysis and a genuinely strong MBA thesis is the connection back to your original research objectives. Every table, chart, and statistical result should trace back to a specific objective or research question stated in your introduction — if you can't point to which objective a given piece of analysis addresses, it likely doesn't belong in the chapter, or you're missing an explicit statement connecting it.
This connection also needs to work in the other direction at the end of your analysis chapter: a clear summary that states, objective by objective, what your data analysis found and what it means for the operational problem your thesis set out to investigate. This summary is often what a supervisor or examiner reads most carefully, since it's where your analysis converts into an actual answer to your research question.
Interpreting Statistical Significance Without Overclaiming
MBA scholars new to statistical analysis sometimes fall into one of two traps: treating a p-value as a magic pass/fail indicator without understanding what it actually means, or reporting a statistically significant result as if it automatically proves practical importance. A p-value below the conventional 0.05 threshold tells you a result is unlikely to have occurred by chance alone, given your sample — it does not tell you the relationship is strong, large, or operationally meaningful, and it does not prove causation from a cross-sectional survey design.
Alongside statistical significance, it's worth reporting effect size where relevant — how large the actual difference or relationship is, not just whether it's statistically detectable — since a small but statistically significant effect in a large sample may have little practical relevance to an operations decision, while a large effect in a small sample might be practically important even if it falls just short of conventional significance thresholds. Being explicit about this distinction in your analysis chapter signals a level of statistical maturity that examiners specifically look for, and it protects you from the common criticism of overclaiming what your data actually supports.
Similarly, be careful with causal language. A correlation between automation level and defect rate across your surveyed plants doesn't establish that automation causes lower defects — other factors (plant age, workforce experience, product complexity) could easily explain both. Phrasing findings as "associated with" rather than "causes" or "leads to," unless your design specifically supports causal inference, keeps your analysis chapter accurate and defensible under examiner questioning.
Real MBA Operations Data Analysis Example
An MBA student analyzing defect rates at a mid-sized electronics assembly plant collected six months of daily defect count data alongside eight staff interviews about process changes during that period. She began with descriptive statistics, establishing the average daily defect rate and its variation across the six months. She then built control charts in Minitab (accessed through her university's software license) to identify whether the process was stable, discovering two distinct periods where defect rates spiked outside normal control limits. Cross-referencing these dates against her interview notes, she found both spikes coincided with a new supplier's raw material batches being introduced — a connection the raw defect data alone wouldn't have revealed, but which became clear once she combined the statistical process control analysis with the qualitative context from her interviews. Her findings chapter presented the control chart clearly, explained the two flagged periods, and directly connected them to her research objective of identifying root causes of quality variation, giving her committee a clear, well-supported, and genuinely useful conclusion.
Common Data Analysis Mistakes in MBA Operations Theses
- Jumping straight to advanced techniques without descriptive statistics first, leaving readers unable to understand the basic shape of the data before evaluating deeper findings.
- Choosing a statistical technique because it sounds sophisticated rather than because it actually fits the research question and data available.
- Presenting charts and tables without interpretation, leaving the reader to guess what conclusion the data supports.
- Ignoring process variation over time when analyzing operational data, treating a single average as the full picture rather than checking whether the process was stable throughout the period studied.
- Overreaching with DEA, simulation, or other specialized techniques without confirming feasibility with a supervisor first, given MBA timeline constraints.
- Failing to connect analysis explicitly back to research objectives, producing a technically competent but disconnected findings chapter.
- Treating qualitative interview data as decoration rather than genuine analytical evidence, mentioning quotes without systematic thematic analysis behind them.
- Not disclosing analysis limitations, such as a small sample size or data access constraints, which weakens credibility more than acknowledging them upfront would.
Data Analysis Checklist
Before finalizing your MBA operations thesis data analysis chapter, confirm you have:
- Descriptive statistics presented before any advanced analysis
- A clearly justified choice of analytical technique matched to your specific data type
- Control charts or capability analysis used if your data involves a process tracked over time
- DEA or other specialized techniques used only where genuinely appropriate and feasible
- Qualitative data (if present) systematically coded and thematically analyzed, not just quoted
- Every chart and table accompanied by written interpretation
- Clear labeling of all axes, units, and time periods on every visual
- Each analytical result explicitly connected back to a specific research objective
- A summary section stating what the analysis found, objective by objective
- Limitations of your data or analysis honestly acknowledged
For guidance on the methodology decisions that shape this analysis stage, our related guide, [research methodology guide for MBA operations dissertations], covers the design choices that determine what data you'll actually be analyzing.
How Long Does It Take to Complete an MBA Thesis Using This Approach?
Data analysis for an MBA operations thesis typically takes three to six weeks within an overall dissertation timeline of three to six months, depending on data complexity and whether both quantitative and qualitative analysis are involved. Scholars who plan their analysis approach during the methodology stage, rather than deciding after data collection is already complete, generally move through this stage faster, since they're not retrofitting an analysis plan onto data that wasn't collected with a specific technique in mind.
Is Professional Help Available to Analyze Data for an MBA Operations Thesis?
Yes — many MBA students work with academic mentors or research consultancies to choose the right analytical technique for their specific data, run statistical or process control analysis correctly, and connect findings clearly back to their research objectives. ThesisLikho's research experts have supported MBA scholars through exactly this stage of operations dissertations, helping ensure analysis is technically sound, appropriately scoped for an MBA timeline, and clearly interpreted for the committee — all while keeping the underlying research and conclusions entirely your own. Explore ThesisLikho's MBA thesis assistance services for one-on-one guidance.
FAQs
How do you analyze data for an MBA operations thesis?
Start with descriptive statistics to understand your data's basic shape, then apply the technique that matches your data type — inferential statistics for survey data, control charts and capability analysis for process data tracked over time, DEA for multi-unit efficiency comparisons, or thematic analysis for interview data — always connecting each result explicitly back to your research objectives.
How long does it take to complete an MBA thesis using this approach?
Data analysis typically takes three to six weeks within an overall MBA operations dissertation timeline of three to six months, faster for scholars who plan their analysis approach during methodology design rather than after data collection.
Is professional help available to analyze data for an MBA operations thesis?
Yes. Research consultancies and academic mentors, including ThesisLikho's experts, help MBA students choose the right analytical technique and interpret findings clearly while preserving full research originality.
Why should I analyze data for an MBA operations thesis carefully?
Because technically weak or poorly interpreted analysis is one of the fastest ways to undermine an otherwise strong dissertation — committees specifically look for evidence that you understand what your data shows and why it matters for your stated research objectives.
When should you analyze data for an MBA operations thesis for a MBA thesis?
Your analysis approach should be planned during your methodology design, before data collection begins, so that the data you collect actually fits the technique you intend to use — deciding on analysis method only after collecting data often means discovering too late that the data doesn't support the intended technique.
Related reading: Research Methodology Guide for MBA Operations Dissertations
Ready to turn your operations data into a defensible thesis chapter?
Get Free MBA Thesis Consultation → https://thesislikho.com/writing-services/thesis-assistance-mba