
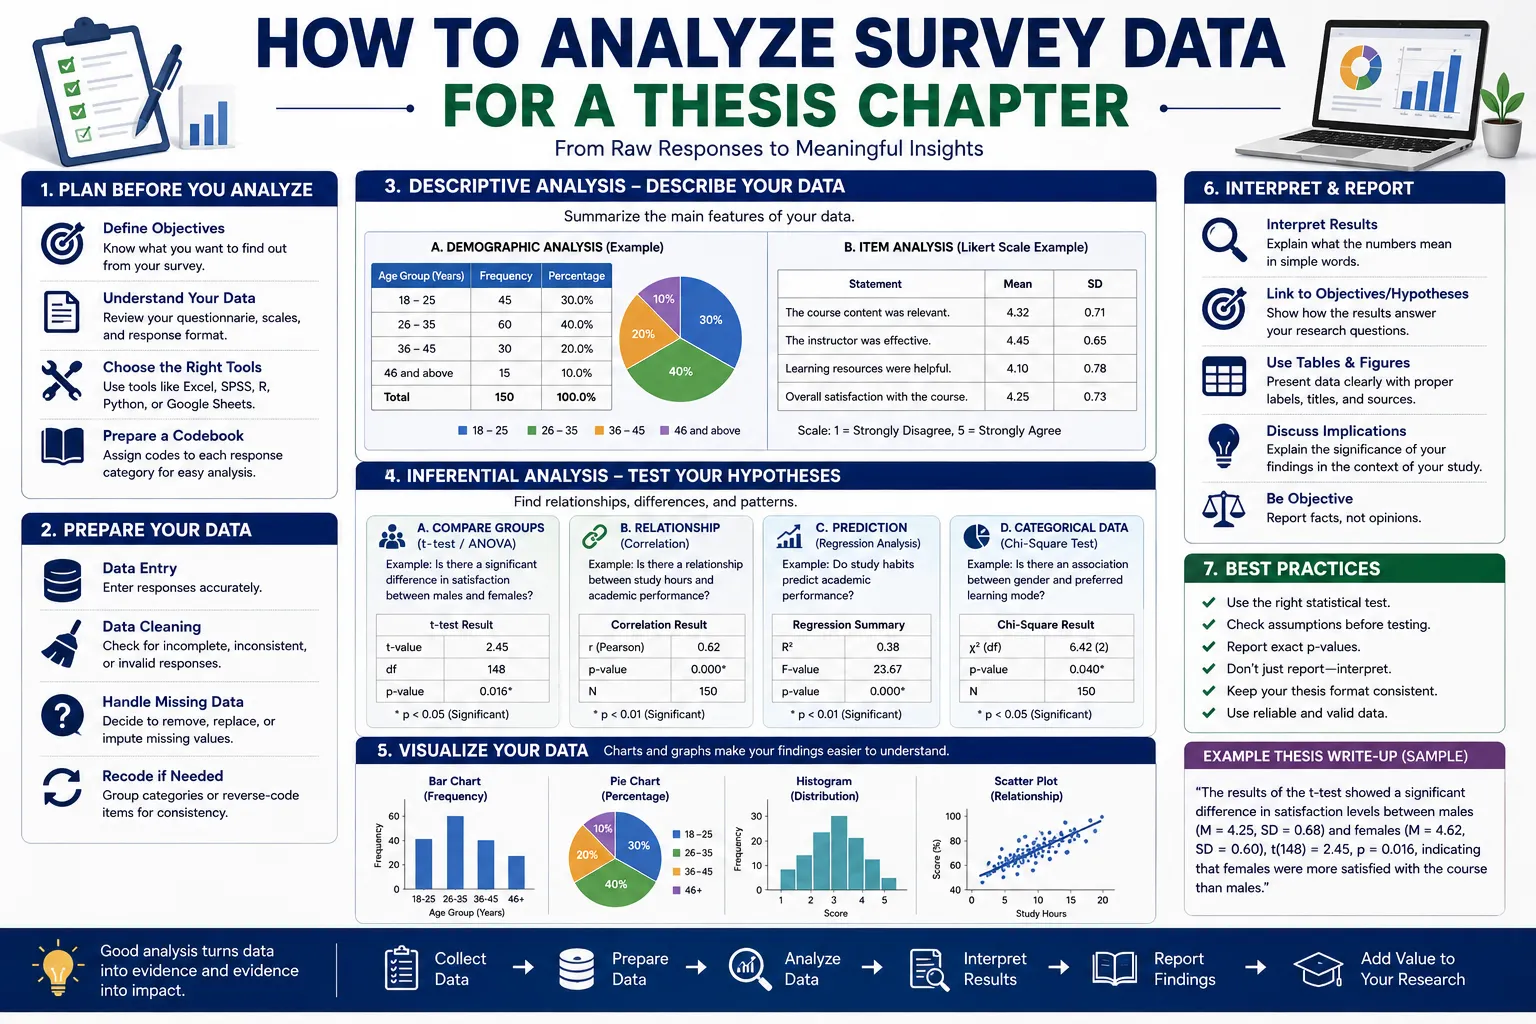
Survey data looks deceptively simple once it's sitting in a spreadsheet — rows of numbers, columns of responses. The complexity hides in the details: a negatively worded item that needs reverse coding, a Likert scale that needs to become a composite score, a reliability check that needs to happen before you trust anything downstream. Get these steps wrong, and your Chapter 4 results can look weak or confusing even when your underlying data collection was solid. This guide walks through how to analyze survey data for a thesis chapter, from coding through to inferential analysis.
Improper recoding silently corrupts datasets and leads to incorrect conclusions, rejected dissertations, and failed hypothesis testing. Many students struggle here not because the underlying statistical concepts are difficult, but because a single mistake in recoding can invalidate an entire analysis without being obvious at first glance. Getting this stage right is foundational to everything that follows.
Step 1: Code Your Survey Responses Correctly
Before any analysis begins, your survey responses need to be converted into properly coded variables. This includes assigning numeric codes to Likert-scale response categories (e.g., 1 = Strongly Disagree through 5 = Strongly Agree), creating value labels so your output tables display meaningful text rather than bare numbers, and coding demographic and categorical variables consistently.
Beyond basic coding, recoding is also used for creating binary variables — for example, recoding gender, employment status, or yes/no responses into 0 and 1 for regression or logistic models — and for collapsing categories when small subgroup sizes would otherwise violate statistical assumptions for certain tests.
Step 2: Identify and Reverse Code Negatively Worded Items
This is the step most commonly missed, and one of the most consequential. Reverse coding is required when a survey item is worded in the opposite direction from other items measuring the same construct. Most Likert-scale questionnaires mix positively and negatively worded items intentionally — for example, a motivation scale might include both "I feel confident completing my dissertation analysis" and "I feel overwhelmed by statistical analysis." If both items are meant to measure the same underlying construct, the negatively worded item needs to be reversed so that higher scores consistently represent higher levels of that construct.
Why This Step Matters So Much
If reverse coding is skipped, items in the same scale pull in opposite directions. This can reduce your Cronbach's Alpha, weaken your correlations, distort your regression results, and make your composite scores genuinely misleading. Here's the trap: a scholar might conclude their scale is unreliable, when the real problem is simply that one or more items were never reversed. In thesis work specifically, this surfaces directly in your results chapter — a reliability table that looks unexpectedly weak, a correlation that looks lower than expected, or a regression model that becomes difficult to explain, are all sometimes traceable back to a missed reverse-coding step rather than a genuine problem with your data or instrument.
The Reverse Coding Formula
The standard formula for reverse coding Likert-type data is: reversed score = (minimum scale value) + (maximum scale value) − actual score. For a common 5-point scale (1 to 5), this simplifies to: reversed value = 6 − original value. For a 7-point scale, it would be 8 minus the original value, following the same logic.
Best Practice: Never Overwrite Your Original Data
Always create a new variable for the reversed item rather than overwriting the original response. This protects your raw data and lets you start over cleanly if a mistake is made during recoding — a genuinely important safeguard, since recoding errors can be difficult to trace back once the original values are gone.
Step 3: Clean Your Dataset — Including Verifying Reverse Coding Worked
After coding is complete, check your dataset carefully before running any statistics. This includes checking for missing responses, duplicate records, out-of-range values, inconsistent labels, and items entered in the wrong columns. This is also the right stage to specifically verify that all reverse-coded items have actually been handled properly — a quick check of descriptive statistics on each reversed item can confirm the direction flipped as intended.
Step 4: Build Composite Scores for Multi-Item Scales
When multiple Likert items measure the same underlying construct — satisfaction, motivation, engagement, and similar constructs are common examples — researchers typically combine them into a composite score, usually by averaging or summing the relevant items. This composite score is commonly treated as approximately continuous in applied research, provided the scale's reliability is adequate. Importantly, reverse-coded items must be handled correctly before combining items into a composite score — an unaddressed reverse-coding error will corrupt the composite itself, not just the individual item.
Step 5: Test Reliability Before Trusting Your Composite Scores
Before using your composite scores in any substantive analysis, run a reliability check — typically Cronbach's Alpha — to confirm your scale items genuinely hang together as a coherent measure. A reliability coefficient that looks unexpectedly low is worth investigating for a missed reverse-coding step before you conclude the instrument itself is weak.
Step 6: Choose Your Analysis Based on How Your Data Is Structured
The appropriate statistical test for Likert-derived data depends on how you're treating it:
- Regression can be used when your composite scores are treated as approximately continuous and the relevant statistical assumptions are reasonably satisfied
- Ordinal logistic regression may be more appropriate if your dependent variable is a single ordered Likert item, rather than a multi-item composite score
- Independent samples t-test is appropriate for comparing a reliable composite score between two groups, when assumptions are met; Mann-Whitney U is the appropriate alternative when they're not
- ANOVA or Kruskal-Wallis for comparing composite scores across three or more groups, depending on whether parametric assumptions hold
Step 7: Consider Factor Analysis for New or Adapted Scales
If your questionnaire uses a new or adapted scale — one not directly taken from an already-validated published instrument — factor analysis is specifically useful for examining its underlying structure, confirming whether your items genuinely group together the way your theoretical framework predicts. As with composite scoring, reverse-coded items must be handled correctly before running factor analysis, since unaddressed coding errors will distort the resulting factor structure.
Step 8: Report Findings With the Full Combination of Descriptive, Reliability, and Inferential Statistics
A well-reported result combines all three layers clearly. A representative example: a satisfaction scale with a mean score of 4.18 (SD = 0.62), a Cronbach's Alpha of 0.84, and a paired t-test result of t(29) = 3.95, p = 0.001. Together, this tells a complete story — the scale is reliable, satisfaction levels are high, and an observed change (in this case, after some intervention) is statistically significant. Reporting only one piece of this combination — just the mean, or just the p-value — leaves your reader without the full picture needed to judge your findings.
Practical Checklist: Is Your Survey Data Analysis Ready?
- All survey responses coded numerically with appropriate value labels
- Negatively worded items identified and reverse coded using the correct formula
- Reversed items saved as new variables, with original data preserved unchanged
- Dataset cleaned for missing responses, duplicates, out-of-range values, and inconsistent labels
- Reverse coding verified through a quick descriptive check before proceeding
- Composite scores built only after all relevant items are correctly reverse coded
- Reliability (Cronbach's Alpha) tested for each composite scale before substantive analysis
- Statistical test chosen based on whether data is treated as continuous composite scores or single ordinal items
- Factor analysis considered for new or adapted scales, with reverse coding confirmed beforehand
- Results reported with the full combination of descriptive, reliability, and inferential statistics
Two Practical Scenarios
Scenario 1 — Diagnosing an Unexpectedly Low Cronbach's Alpha A scholar analyzing a workplace motivation scale calculated a Cronbach's Alpha of 0.41 — well below the acceptable threshold — despite the questionnaire being adapted from a previously validated instrument. Rather than concluding the scale itself was unreliable, the scholar reviewed the item wording and discovered one item ("I often feel disengaged from my work") had never been reverse coded, despite measuring the same construct in the opposite direction from the other items. After correctly reverse coding this item using the (max + min − score) formula and recalculating, Cronbach's Alpha rose to 0.81 — revealing that the original low reliability was a coding error, not a genuine instrument problem.
Scenario 2 — Choosing the Right Test for Composite Scale Comparison A scholar wanted to compare job satisfaction composite scores (built from a validated 8-item Likert scale) between employees in two departments. After confirming the composite score's reliability and checking normality, the scholar found the distribution was reasonably normal with a large enough sample per group, and used an independent samples t-test — reporting the test statistic, degrees of freedom, exact p-value, and effect size, along with the descriptive means for each department, giving a complete and defensible presentation of the comparison.
Common Mistakes Thesis Writers Make Analyzing Survey Data
- Skipping reverse coding entirely, especially when negatively worded items aren't immediately obvious in a long questionnaire.
- Overwriting original survey data during recoding instead of creating new variables, making mistakes difficult to trace or correct.
- Building composite scores before verifying reverse coding was applied correctly, corrupting the resulting scale scores.
- Treating a single ordinal Likert item as if it were a continuous composite score without an adequate justification.
- Reporting only descriptive statistics or only the p-value, rather than combining descriptive, reliability, and inferential results into a complete picture.
Frequently Asked Questions
How do you analyze survey data for a thesis chapter?
Start by coding your responses correctly, identify and reverse code any negatively worded items using the (minimum + maximum − score) formula, clean your dataset, build composite scores from correctly reverse-coded items, test reliability with Cronbach's Alpha, and then choose your statistical test based on whether you're working with composite scores or single ordinal items.
Why does reverse coding matter so much when analyzing survey data?
Skipping reverse coding causes items measuring the same construct to pull in opposite directions, which can reduce reliability, weaken correlations, and distort regression results — often making a perfectly good scale appear unreliable when the real issue is a missed coding step.
How does survey data analysis affect a thesis's overall credibility?
Errors in coding and reverse scoring surface directly in the results chapter as unexpectedly weak reliability figures or hard-to-explain regression results, which examiners familiar with survey methodology are likely to notice and question.
How long does it take to complete a thesis using this approach?
Careful coding and verification upfront typically saves time overall, since catching a reverse-coding error before building composite scores and running inferential tests avoids having to redo an entire analysis after the fact.
Is professional help available to analyze survey data for a thesis chapter?
Yes. ThesisLikho's PhD-qualified experts have guided 10,000+ scholars through survey data coding, reliability testing, and complete thesis writing assistance tailored to individual research designs.
Get Expert Guidance on Your Survey Data Analysis
Analyzing survey data correctly takes careful attention to coding, reverse scoring, and composite score construction — small details that can quietly undermine an otherwise well-collected dataset. If you'd like expert input on coding, cleaning, or analyzing your thesis survey data, ThesisLikho's PhD-qualified team offers survey data analysis support, reliability testing guidance, and complete thesis writing assistance. If you need expert guidance with your data analysis, statistical test selection, or overall results chapter, you can explore our Thesis Writing Assistance service.
Using Python for Thesis Data Analysis: A Practical Guide , Descriptive vs Inferential Statistics: What Your Thesis Needs
Talk to a Thesis Expert → https://thesislikho.com/writing-services/thesis-writing